CenturyLink 2015 Annual Report Download - page 134
Download and view the complete annual report
Please find page 134 of the 2015 CenturyLink annual report below. You can navigate through the pages in the report by either clicking on the pages listed below, or by using the keyword search tool below to find specific information within the annual report.-
 1
1 -
2
-
3
-
4
-
5
-
6
-
7
-
8
-
9
-
10
-
11
-
12
-
13
-
14
-
15
-
16
-
17
-
18
-
19
-
20
-
21
-
22
-
23
-
24
-
25
-
26
-
27
-
28
-
29
-
30
-
31
-
32
-
33
-
34
-
35
-
36
-
37
-
38
-
39
-
40
-
41
-
42
-
43
-
44
-
45
-
46
-
47
-
48
-
49
-
50
-
51
-
52
-
53
-
54
-
55
-
56
-
57
-
58
-
59
-
60
-
61
-
62
-
63
-
64
-
65
-
66
-
67
-
68
-
69
-
70
-
71
-
72
-
73
-
74
-
75
-
76
-
77
-
78
-
79
-
80
-
81
-
82
-
83
-
84
-
85
-
86
-
87
-
88
-
89
-
90
-
91
-
92
-
93
-
94
-
95
-
96
-
97
-
98
-
99
-
100
-
101
-
102
-
103
-
104
-
105
-
106
-
107
-
108
-
109
-
110
-
111
-
112
-
113
-
114
-
115
-
116
-
117
-
118
-
119
-
120
-
121
-
122
-
123
-
 124
124 -
 125
125 -
 126
126 -
 127
127 -
 128
128 -
 129
129 -
 130
130 -
 131
131 -
 132
132 -
 133
133 -
 134
134 -
 135
135 -
 136
136 -
 137
137 -
 138
138 -
 139
139 -
 140
140 -
 141
141 -
 142
142 -
 143
143 -
 144
144 -
145
-
146
-
147
-
148
-
149
-
150
-
151
-
152
-
153
-
154
-
155
-
156
-
157
-
158
-
159
-
160
-
161
-
162
-
163
-
164
-
165
-
166
-
167
-
168
-
169
-
170
-
171
-
172
-
173
-
174
-
175
-
176
-
177
-
178
-
179
-
180
-
181
-
182
-
183
-
184
-
185
-
186
-
187
-
188
-
189
-
190
-
191
-
192
-
193
-
194
-
195
-
196
-
197
-
198
-
199
-
200
-
201
-
202
 |
 |
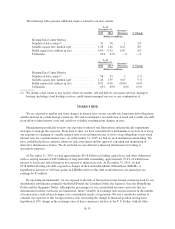
under the CAF Phase 2 program would have increased or decreased our revenue up to $3 million or $9 million,
respectively, in 2015.
For additional information about the CAF Phase 2 support program, see the discussion below in “Liquidity
and Capital Resources—Connect America Fund.”
Income Taxes
Our provision for income taxes includes amounts for tax consequences deferred to future periods. We record
deferred income tax assets and liabilities reflecting future tax consequences attributable to tax credit
carryforwards, differences between the financial statement carrying value of assets and liabilities and the tax
bases of those assets and liabilities and tax net operating losses, or NOLs. Deferred taxes are computed using
enacted tax rates expected to apply in the year in which the differences are expected to affect taxable income.
The effect on deferred income tax assets and liabilities of a change in tax rate is recognized in earnings in the
period that includes the enactment date.
The measurement of deferred taxes often involves the exercise of considerable judgment related to the
realization of tax basis. Our deferred tax assets and liabilities reflect our assessment that tax positions taken in
filed tax returns and the resulting tax basis, are more likely than not to be sustained if they are audited by taxing
authorities. Assessing tax rates that we expect to apply and determining the years when the temporary differences
are expected to affect taxable income requires judgment about the future apportionment of our income among the
states in which we operate. Any changes in our practices or judgments involved in the measurement of deferred
tax assets and liabilities could materially impact our financial condition or results of operations.
In connection with recording deferred income tax assets and liabilities, we establish valuation allowances
when necessary to reduce deferred income tax assets to amounts that we believe are more likely than not to be
realized. We evaluate our deferred tax assets quarterly to determine whether adjustments to our valuation
allowance are appropriate in light of changes in facts or circumstances, such as changes in tax law, interactions
with taxing authorities and developments in case law. In making this evaluation, we rely on our recent history of
pre-tax earnings. We also rely on our forecasts of future earnings and the nature and timing of future deductions
and benefits represented by the deferred tax assets, all which involve the exercise of significant judgment. At
December 31, 2015, we established a valuation allowance of $380 million, primarily related to state NOLs, as it
is more likely than not that these NOLs will expire unused. If forecasts of future earnings and the nature and
estimated timing of future deductions and benefits change in the future, we may determine that a valuation
allowance for certain deferred tax assets is appropriate, which could materially impact our financial condition or
results of operations. See Note 11—Income Taxes to our consolidated financial statements in Item 8 of our
Annual Report on Form 10-K for the year ended December 31, 2015 for additional information.
LIQUIDITY AND CAPITAL RESOURCES
Overview
At December 31, 2015, we held cash and cash equivalents of $126 million and we had approximately
$1.7 billion of borrowing capacity available under our $2.0 billion amended and restated revolving credit facility
(referred to as our “Credit Facility”, which is described further below). At December 31, 2015, cash and cash
equivalents of $62 million were held in foreign bank accounts for the purpose of funding our foreign operations.
Due to various factors, our access to foreign cash is generally much more restricted than our access to domestic
cash.
In connection with our budgeting process in early 2016, our executive officers and our Board of Directors
reviewed our sources and potential uses of cash over the next several years, including among other things the
previously-disclosed effect of the anticipated depletion of our federal net operating loss carryforwards during
B-26