CenturyLink 2015 Annual Report Download - page 126
Download and view the complete annual report
Please find page 126 of the 2015 CenturyLink annual report below. You can navigate through the pages in the report by either clicking on the pages listed below, or by using the keyword search tool below to find specific information within the annual report.-
 1
1 -
2
-
3
-
4
-
5
-
6
-
7
-
8
-
9
-
10
-
11
-
12
-
13
-
14
-
15
-
16
-
17
-
18
-
19
-
20
-
21
-
22
-
23
-
24
-
25
-
26
-
27
-
28
-
29
-
30
-
31
-
32
-
33
-
34
-
35
-
36
-
37
-
38
-
39
-
40
-
41
-
42
-
43
-
44
-
45
-
46
-
47
-
48
-
49
-
50
-
51
-
52
-
53
-
54
-
55
-
56
-
57
-
58
-
59
-
60
-
61
-
62
-
63
-
64
-
65
-
66
-
67
-
68
-
69
-
70
-
71
-
72
-
73
-
74
-
75
-
76
-
77
-
78
-
79
-
80
-
81
-
82
-
83
-
84
-
85
-
86
-
87
-
88
-
89
-
90
-
91
-
92
-
93
-
94
-
95
-
96
-
97
-
98
-
99
-
100
-
101
-
102
-
103
-
104
-
105
-
106
-
107
-
108
-
109
-
110
-
111
-
112
-
113
-
114
-
115
-
 116
116 -
 117
117 -
 118
118 -
 119
119 -
 120
120 -
 121
121 -
 122
122 -
 123
123 -
 124
124 -
 125
125 -
 126
126 -
 127
127 -
 128
128 -
 129
129 -
 130
130 -
 131
131 -
 132
132 -
 133
133 -
 134
134 -
 135
135 -
 136
136 -
137
-
138
-
139
-
140
-
141
-
142
-
143
-
144
-
145
-
146
-
147
-
148
-
149
-
150
-
151
-
152
-
153
-
154
-
155
-
156
-
157
-
158
-
159
-
160
-
161
-
162
-
163
-
164
-
165
-
166
-
167
-
168
-
169
-
170
-
171
-
172
-
173
-
174
-
175
-
176
-
177
-
178
-
179
-
180
-
181
-
182
-
183
-
184
-
185
-
186
-
187
-
188
-
189
-
190
-
191
-
192
-
193
-
194
-
195
-
196
-
197
-
198
-
199
-
200
-
201
-
202
 |
 |

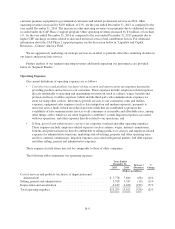
(1) Includes MPLS and Ethernet revenue
(2) Includes private line and high-speed Internet revenue
(3) Includes colocation, hosting (including cloud hosting and managed hosting) and hosting area network
revenue
(4) Includes primarily VoIP, video and IT services revenue
(5) Includes local and long-distance voice revenue
(6) Includes UNEs, public access and other ancillary revenue
Segment Revenues
Business segment revenues decreased by $387 million, or 4%, for the year ended December 31, 2015 as
compared to the year ended December 31, 2014. The decrease in business segment revenues was primarily due to
declines in legacy services revenues, private line (including special access) revenues in our strategic services and
data integration revenues. The decline in legacy services revenues was attributable to a reduction in local service
access lines and lower volumes of long-distance, access and traditional WAN services for the reasons noted
above. The decline in our strategic services revenues was primarily due to a reduction in hosting services and
private line (including special access) volumes, as well as a pricing change on private line services for a large
wholesale customer in exchange for a longer term commitment. These declines were partially offset by MPLS
unit growth and higher Ethernet volumes. The decrease in data integration revenues was primarily due to lower
sales of customer premises equipment to governmental and business customers during the period. Business
segment revenues decreased by $57 million, or 1%, for the year ended December 31, 2014 as compared to the
year ended December 31, 2013. The decrease in business segment revenues was primarily due to the decline in
legacy services revenues, which were partially offset by the growth in our strategic services and data integration
revenues. The decline in legacy services revenues was attributable to lower volumes of local access and
traditional WAN services. The growth in our strategic services revenues was primarily due to MPLS unit growth
and higher Ethernet volume, which were substantially offset by a decline in private line (including special
access) services. The increase in data integration revenues was primarily due to higher sales of customer
premises equipment to governmental customers during the period.
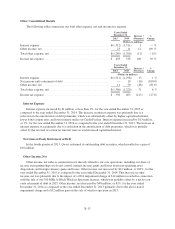
Segment Expenses
Business segment expenses decreased by $55 million, or 1%, for the year ended December 31, 2015 as
compared to the year ended December 31, 2014. The decrease was due primarily to reductions in customer
premises equipment costs resulting from the lower sales noted above in segment revenues. Excluding the lower
customer premises equipment costs, business expenses increased by $59 million for the year ended December 31,
2015 as compared to the year ended December 31, 2014. The increase is primarily due to increases in salaries
and wages, benefits expense, external commissions, network expense and facility costs, which were partially
offset by decreases in professional fees, materials and supplies and fleet expenses. Business segment expenses
increased by $281 million, or 5%, for the year ended December 31, 2014 as compared to the year ended
December 31, 2013. The increase was primarily due to increases in employee-related costs attributable to higher
wages, benefits and internal commissions, customer premises equipment costs resulting from higher sales noted
above, facility costs driven by MPLS unit growth and real estate and power costs.
Segment Income
Business segment income decreased by $332 million, or 7%, for the year ended December 31, 2015 as
compared to the year ended December 31, 2014. The decrease in business segment income was due to the loss of
customers and lower service volumes in our legacy services and to the increase in operating expenses, excluding
the impact of the reduction in customer premises equipment costs. Business segment income decreased by $338
million, or 6%, for the year ended December 31, 2014 as compared to the year ended December 31, 2013. The
decrease was primarily due to customers migrating from legacy services to lower margin strategic services.
B-18