CenturyLink 2015 Annual Report Download - page 192
Download and view the complete annual report
Please find page 192 of the 2015 CenturyLink annual report below. You can navigate through the pages in the report by either clicking on the pages listed below, or by using the keyword search tool below to find specific information within the annual report.-
 1
1 -
2
-
3
-
4
-
5
-
6
-
7
-
8
-
9
-
10
-
11
-
12
-
13
-
14
-
15
-
16
-
17
-
18
-
19
-
20
-
21
-
22
-
23
-
24
-
25
-
26
-
27
-
28
-
29
-
30
-
31
-
32
-
33
-
34
-
35
-
36
-
37
-
38
-
39
-
40
-
41
-
42
-
43
-
44
-
45
-
46
-
47
-
48
-
49
-
50
-
51
-
52
-
53
-
54
-
55
-
56
-
57
-
58
-
59
-
60
-
61
-
62
-
63
-
64
-
65
-
66
-
67
-
68
-
69
-
70
-
71
-
72
-
73
-
74
-
75
-
76
-
77
-
78
-
79
-
80
-
81
-
82
-
83
-
84
-
85
-
86
-
87
-
88
-
89
-
90
-
91
-
92
-
93
-
94
-
95
-
96
-
97
-
98
-
99
-
100
-
101
-
102
-
103
-
104
-
105
-
106
-
107
-
108
-
109
-
110
-
111
-
112
-
113
-
114
-
115
-
116
-
117
-
118
-
119
-
120
-
121
-
122
-
123
-
124
-
125
-
126
-
127
-
128
-
129
-
130
-
131
-
132
-
133
-
134
-
135
-
136
-
137
-
138
-
139
-
140
-
141
-
142
-
143
-
144
-
145
-
146
-
147
-
148
-
149
-
150
-
151
-
152
-
153
-
154
-
155
-
156
-
157
-
158
-
159
-
160
-
161
-
162
-
163
-
164
-
165
-
166
-
167
-
168
-
169
-
170
-
171
-
172
-
173
-
174
-
175
-
176
-
177
-
178
-
179
-
180
-
181
-
 182
182 -
 183
183 -
 184
184 -
 185
185 -
 186
186 -
 187
187 -
 188
188 -
 189
189 -
 190
190 -
 191
191 -
 192
192 -
 193
193 -
 194
194 -
 195
195 -
 196
196 -
 197
197 -
 198
198 -
 199
199 -
 200
200 -
 201
201 -
 202
202
 |
 |

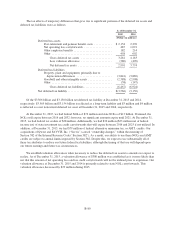
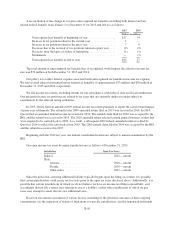
Our operating revenues for our products and services consisted of the following categories for the years
ended December 31, 2015, 2014 and 2013:
Years Ended December 31,
2015 2014 2013
(Dollars in millions)
Strategic services
Business high-bandwidth data services(1) ...... $ 2,816 2,579 2,230
Business low-bandwidth data services(2) ...... 2,052 2,345 2,577
Business hosting services(3) ................ 1,281 1,316 1,259
Other business strategic services(4) ........... 162 76 60
Consumer high-speed Internet services(5) ..... 2,611 2,469 2,358
Other consumer strategic services(6) .......... 421 381 292
Total strategic services revenues .......... 9,343 9,166 8,776
Legacy services
Business legacy voice services(7) ............ 2,590 2,780 2,916
Other business legacy services(8) ............ 1,175 1,252 1,398
Consumer legacy voice services(7) ........... 2,676 2,864 3,101
Other consumer legacy services(9) ........... 311 276 248
Total legacy services revenues ............ 6,752 7,172 7,663
Data integration
Business data integration .................. 571 686 651
Consumer data integration ................. 2 4 5
Total data integration revenues ........... 573 690 656
Other revenues ............................
High-cost support revenue(10) ............... 732 528 547
Other revenue(11) ......................... 500 475 453
Total other revenues .................... 1,232 1,003 1,000
Total revenues ............................ $17,900 18,031 18,095
(1) Includes MPLS and Ethernet revenue
(2) Includes private line and high-speed Internet revenue
(3) Includes colocation, hosting (including cloud hosting and managed hosting) and hosting area network
revenue
(4) Includes primarily VoIP, video and IT services revenue
(5) Includes high-speed Internet and related services revenue
(6) Includes video and Verizon wireless revenue
(7) Includes local and long-distance voice revenue
(8) Includes UNEs, public access and other ancillary revenue
(9) Includes switched access and other ancillary revenue
(10) Includes CAF Phase 1, CAF Phase 2 and federal and state USF support revenue
(11) Includes USF surcharges
During the first quarter of 2015, we determined that certain products and services associated with our
acquisition of Savvis are more closely aligned to legacy services than to strategic services. As a result, these
operating revenues are now reflected as legacy services. The revision resulted in a reduction of revenue from
strategic services of $34 million and $47 million and a corresponding increase in revenue from legacy services
for the years ended December 31, 2014 and 2013, respectively.
B-84