The Hartford 2007 Annual Report Download - page 93
Download and view the complete annual report
Please find page 93 of the 2007 The Hartford annual report below. You can navigate through the pages in the report by either clicking on the pages listed below, or by using the keyword search tool below to find specific information within the annual report.-
 1
1 -
2
-
3
-
4
-
5
-
6
-
7
-
8
-
9
-
10
-
11
-
12
-
13
-
14
-
15
-
16
-
17
-
18
-
19
-
20
-
21
-
22
-
23
-
24
-
25
-
26
-
27
-
28
-
29
-
30
-
31
-
32
-
33
-
34
-
35
-
36
-
37
-
38
-
39
-
40
-
41
-
42
-
43
-
44
-
45
-
46
-
47
-
48
-
49
-
50
-
51
-
52
-
53
-
54
-
55
-
56
-
57
-
58
-
59
-
60
-
61
-
62
-
63
-
64
-
65
-
66
-
67
-
68
-
69
-
70
-
71
-
72
-
73
-
74
-
75
-
76
-
77
-
78
-
79
-
80
-
81
-
82
-
 83
83 -
 84
84 -
 85
85 -
 86
86 -
 87
87 -
 88
88 -
 89
89 -
 90
90 -
 91
91 -
 92
92 -
 93
93 -
 94
94 -
 95
95 -
 96
96 -
 97
97 -
 98
98 -
 99
99 -
 100
100 -
 101
101 -
 102
102 -
 103
103 -
104
-
105
-
106
-
107
-
108
-
109
-
110
-
111
-
112
-
113
-
114
-
115
-
116
-
117
-
118
-
119
-
120
-
121
-
122
-
123
-
124
-
125
-
126
-
127
-
128
-
129
-
130
-
131
-
132
-
133
-
134
-
135
-
136
-
137
-
138
-
139
-
140
-
141
-
142
-
143
-
144
-
145
-
146
-
147
-
148
-
149
-
150
-
151
-
152
-
153
-
154
-
155
-
156
-
157
-
158
-
159
-
160
-
161
-
162
-
163
-
164
-
165
-
166
-
167
-
168
-
169
-
170
-
171
-
172
-
173
-
174
-
175
-
176
-
177
-
178
-
179
-
180
-
181
-
182
-
183
-
184
-
185
-
186
-
187
-
188
-
189
-
190
-
191
-
192
-
193
-
194
-
195
-
196
-
197
-
198
-
199
-
200
-
201
-
202
-
203
-
204
-
205
-
206
-
207
-
208
-
209
-
210
-
211
-
212
-
213
-
214
-
215
-
216
-
217
-
218
-
219
-
220
-
221
-
222
-
223
-
224
-
225
-
226
-
227
-
228
-
229
-
230
-
231
-
232
-
233
-
234
-
235
-
236
-
237
-
238
-
239
-
240
-
241
-
242
-
243
-
244
-
245
-
246
-
247
-
248
-
249
-
250
-
251
-
252
-
253
-
254
-
255
-
256
-
257
-
258
-
259
-
260
-
261
-
262
-
263
-
264
-
265
-
266
-
267
-
268
-
269
-
270
-
271
-
272
-
273
-
274
-
275
-
276
 |
 |

93
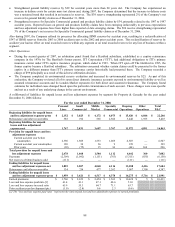
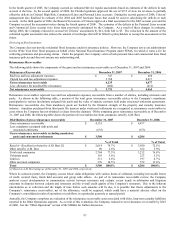
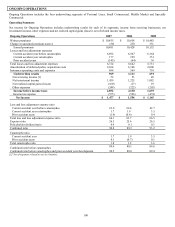
Impact of Re-estimates
As explained in connection with the Company’s discussion of Critical Accounting Estimates, the establishment of Property and Casualty
reserves is an estimation process, using a variety of methods, assumptions and data elements. Ultimate losses may vary significantly
from the current estimates. Many factors can contribute to these variations and the need to change the previous estimate of required
reserve levels. Subsequent changes can generally be thought of as being the result of the emergence of additional facts that were not
known or anticipated at the time of the prior reserve estimate and/or changes in interpretations of information and trends.
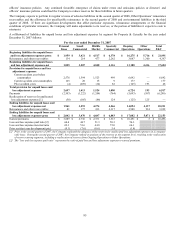
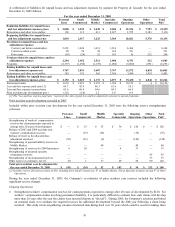
The table below shows the range of annual reserve re-estimates experienced by The Hartford over the past three years. The amount of
prior accident year development (as shown in the reserve rollforward) for a given calendar year is expressed as a percent of the
beginning calendar year reserves, net of reinsurance. The percentage relationships presented are significantly influenced by the facts
and circumstances of each particular year and by the fact that only the last three years are included in the range. Accordingly, these
percentages are not intended to be a prediction of the range of possible future variability. See “Impact of key assumptions on reserve
volatility” within Critical Accounting Estimates for further discussion of the potential for variability in recorded loss reserves.
Personal Lines
Small
Commercial
Middle
Market
Specialty
Commercial
Ongoing
Operations
Other
Operations
Total
P&C
Range of prior accident year
development for the three years
ended December 31, 2007 [1] [2] (5.2) – (0.2) (6.5) – (1.0) (0.3) – 1.6 0.9 – 3.1
(1.1) – 0.3 3.9 – 7.4 (0.6) – 1.5
[1] Bracketed prior accident year development indicates favorable development. Unbracketed amounts represent unfavorable development.
[2] Over the past ten years, reserve re-estimates for total Property & Casualty ranged from (1.3)% to 21.5%. Before the reserve strengthening for
asbestos and environmental reserves, over the past ten years reserve re-estimates for total Property & Casualty ranged from (3.0)% to 1.6%.
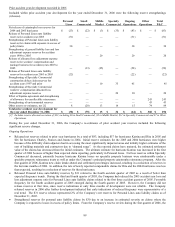
The potential variability of the Company’ s Property & Casualty reserves would normally be expected to vary by segment and the types
of loss exposures insured by those segments. Illustrative factors influencing the potential reserve variability for each of the segments are
discussed under Critical Accounting Estimates.
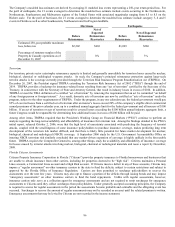
Risk Management Strategy
The Hartford's property and casualty operations have processes to manage risk to natural disasters, such as hurricanes and earthquakes,
and other perils, such as terrorism. The Hartford's risk management processes include, but are not limited to, disciplined underwriting
protocols, exposure controls, sophisticated risk modeling, risk transfer, and capital management strategies.
In managing risk, The Hartford's management processes involve establishing underwriting guidelines for both individual risks, including
individual policy limits, and in aggregate, including aggregate exposure limits by geographic zone and peril. The Company establishes
risk limits and actively monitors the risk exposures as a percent of Property & Casualty statutory surplus. For natural catastrophe perils,
the Company limits its estimated loss to natural catastrophes from a single 250-year event prior to reinsurance to less than 30% of
statutory surplus of the Property & Casualty operations and its estimated loss to natural catastrophes from a single 250-year event after
reinsurance to less than 15% of statutory surplus of the Property & Casualty operations. For terrorism, the Company monitors its
exposure in major metropolitan areas to a single-site conventional terrorism attack scenario, and manages its potential estimated loss,
including exposures resulting from the Company's Group Life operations, to less than $800, which is approximately 5% of the combined
statutory surplus of the Life and Property and Casualty operations as of December 31, 2007. Among the 251 locations specifically
monitored by the Company, the largest estimated modeled loss arising from a single event is approximately $790. The Company
monitors exposures monthly and employs both internally developed and vendor-licensed loss modeling tools as part of its risk
management discipline.
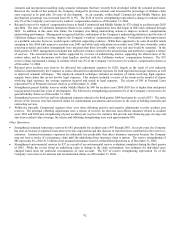
Use of Reinsurance
In managing risk, The Hartford utilizes reinsurance to transfer risk to well-established and financially secure reinsurers. Reinsurance is
used to manage aggregations of risk as well as specific risks based on accumulated property and casualty liabilities in certain geographic
zones. All treaty purchases related to the Company’ s property and casualty operations are administered by a centralized function to
support a consistent strategy and ensure that the reinsurance activities are fully integrated into the organization’ s risk management
processes.
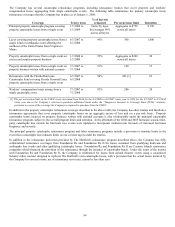
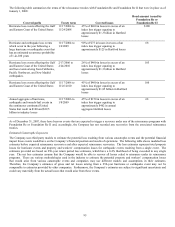
A variety of traditional reinsurance products are used as part of the Company’ s risk management strategy, including excess of loss
occurrence-based products that protect property and workers’ compensation exposures, and individual risk or quota share arrangements,
that protect specific classes or lines of business. There are no significant finite risk contracts in place and the statutory surplus benefit
from all such prior year contracts is immaterial. Facultative reinsurance is also used to manage policy-specific risk exposures based on
established underwriting guidelines. The Hartford also participates in governmentally administered reinsurance facilities such as the
Florida Hurricane Catastrophe Fund (“FHCF”), the Terrorism Risk Insurance Program established under The Terrorism Risk Insurance
Program Reauthorization Act of 2007 (“TRIPRA”) and other reinsurance programs relating to particular risks or specific lines of
business.