The Hartford 2007 Annual Report Download - page 182
Download and view the complete annual report
Please find page 182 of the 2007 The Hartford annual report below. You can navigate through the pages in the report by either clicking on the pages listed below, or by using the keyword search tool below to find specific information within the annual report.-
 1
1 -
2
-
3
-
4
-
5
-
6
-
7
-
8
-
9
-
10
-
11
-
12
-
13
-
14
-
15
-
16
-
17
-
18
-
19
-
20
-
21
-
22
-
23
-
24
-
25
-
26
-
27
-
28
-
29
-
30
-
31
-
32
-
33
-
34
-
35
-
36
-
37
-
38
-
39
-
40
-
41
-
42
-
43
-
44
-
45
-
46
-
47
-
48
-
49
-
50
-
51
-
52
-
53
-
54
-
55
-
56
-
57
-
58
-
59
-
60
-
61
-
62
-
63
-
64
-
65
-
66
-
67
-
68
-
69
-
70
-
71
-
72
-
73
-
74
-
75
-
76
-
77
-
78
-
79
-
80
-
81
-
82
-
83
-
84
-
85
-
86
-
87
-
88
-
89
-
90
-
91
-
92
-
93
-
94
-
95
-
96
-
97
-
98
-
99
-
100
-
101
-
102
-
103
-
104
-
105
-
106
-
107
-
108
-
109
-
110
-
111
-
112
-
113
-
114
-
115
-
116
-
117
-
118
-
119
-
120
-
121
-
122
-
123
-
124
-
125
-
126
-
127
-
128
-
129
-
130
-
131
-
132
-
133
-
134
-
135
-
136
-
137
-
138
-
139
-
140
-
141
-
142
-
143
-
144
-
145
-
146
-
147
-
148
-
149
-
150
-
151
-
152
-
153
-
154
-
155
-
156
-
157
-
158
-
159
-
160
-
161
-
162
-
163
-
164
-
165
-
166
-
167
-
168
-
169
-
170
-
171
-
 172
172 -
 173
173 -
 174
174 -
 175
175 -
 176
176 -
 177
177 -
 178
178 -
 179
179 -
 180
180 -
 181
181 -
 182
182 -
 183
183 -
 184
184 -
 185
185 -
 186
186 -
 187
187 -
 188
188 -
 189
189 -
 190
190 -
 191
191 -
 192
192 -
193
-
194
-
195
-
196
-
197
-
198
-
199
-
200
-
201
-
202
-
203
-
204
-
205
-
206
-
207
-
208
-
209
-
210
-
211
-
212
-
213
-
214
-
215
-
216
-
217
-
218
-
219
-
220
-
221
-
222
-
223
-
224
-
225
-
226
-
227
-
228
-
229
-
230
-
231
-
232
-
233
-
234
-
235
-
236
-
237
-
238
-
239
-
240
-
241
-
242
-
243
-
244
-
245
-
246
-
247
-
248
-
249
-
250
-
251
-
252
-
253
-
254
-
255
-
256
-
257
-
258
-
259
-
260
-
261
-
262
-
263
-
264
-
265
-
266
-
267
-
268
-
269
-
270
-
271
-
272
-
273
-
274
-
275
-
276
 |
 |

F-5
THE HARTFORD FINANCIAL SERVICES GROUP, INC.
Consolidated Statements of Changes in Stockholders’ Equity
For the years ended December 31,
(In millions, except for share data) 2007 2006 2005
Common Stock/Additional Paid-in Capital
Balance at beginning of year $ 6,324 $ 5,070 $ 4,570
Issuance of shares from equity unit contracts — 1,020 —
Issuance of shares and compensation expense associated with incentive and
stock compensation plans
257
190
443
Tax benefit on employee stock options and awards and other 49 44 57
Balance at end of year 6,630 6,324 5,070
Retained Earnings
Balance at beginning of year, before cumulative effect of accounting
changes, net of tax
12,421
10,207
8,283
Cumulative effect of accounting changes, net of tax (41) — —
Balance at beginning of year, as adjusted 12,380 10,207 8,283
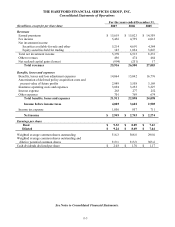
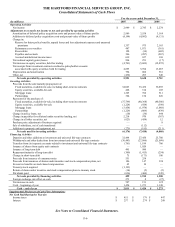
Net income 2,949 2,745 2,274
Dividends declared on common stock (643) (531) (350)
Balance at end of year 14,686 12,421 10,207
Treasury Stock, at Cost
Balance at beginning of year (47) (42) (40)
Treasury stock acquired (1,193) — —
Return of shares to treasury stock under incentive and stock compensation plans (14) (5) (2)
Balance at end of year (1,254) (47) (42)
Accumulated Other Comprehensive Income (Loss), Net of Tax
Balance at beginning of year 178 90 1,425
Total other comprehensive income (loss) (1,036) 554 (1,335)
Adjustment to initially apply SFAS 158, net of tax — (466) —
Balance at end of year (858) 178 90
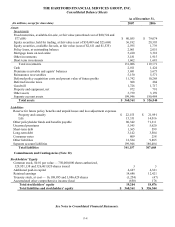
Total stockholders’ equity $ 19,204 $ 18,876 $ 15,325
Outstanding Shares (in thousands)
Balance at beginning of year 323,315 302,152 294,208
Issuance of shares from equity unit contracts — 17,856 —
Issuance of shares under incentive and stock compensation plans 3,549 3,358 7,988
Treasury stock acquired (12,878) — —
Return of shares to treasury stock under incentive and stock compensation plans (144) (51) (44)
Balance at end of year 313,842 323,315 302,152
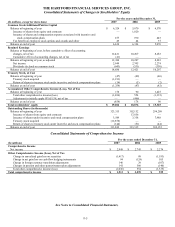
Consolidated Statements of Comprehensive Income
For the years ended December 31,
(In millions) 2007 2006 2005
Comprehensive Income
Net income $ 2,949 $ 2,745 $ 2,274
Other Comprehensive Income (Loss), Net of Tax
Change in unrealized gain/loss on securities (1,417) 89 (1,193)
Change in net gain/loss on cash-flow hedging instruments 94 (124) 105
Change in foreign currency translation adjustments 146 29 (107)
Changes in pension and other postretirement plan adjustments 141 560 (140)
Total other comprehensive income (loss) (1,036) 554 (1,335)
Total comprehensive income $ 1,913 $ 3,299 $ 939
See Notes to Consolidated Financial Statements.