The Hartford 2007 Annual Report Download - page 55
Download and view the complete annual report
Please find page 55 of the 2007 The Hartford annual report below. You can navigate through the pages in the report by either clicking on the pages listed below, or by using the keyword search tool below to find specific information within the annual report.-
 1
1 -
2
-
3
-
4
-
5
-
6
-
7
-
8
-
9
-
10
-
11
-
12
-
13
-
14
-
15
-
16
-
17
-
18
-
19
-
20
-
21
-
22
-
23
-
24
-
25
-
26
-
27
-
28
-
29
-
30
-
31
-
32
-
33
-
34
-
35
-
36
-
37
-
38
-
39
-
40
-
41
-
42
-
43
-
44
-
 45
45 -
 46
46 -
 47
47 -
 48
48 -
 49
49 -
 50
50 -
 51
51 -
 52
52 -
 53
53 -
 54
54 -
 55
55 -
 56
56 -
 57
57 -
 58
58 -
 59
59 -
 60
60 -
 61
61 -
 62
62 -
 63
63 -
 64
64 -
 65
65 -
66
-
67
-
68
-
69
-
70
-
71
-
72
-
73
-
74
-
75
-
76
-
77
-
78
-
79
-
80
-
81
-
82
-
83
-
84
-
85
-
86
-
87
-
88
-
89
-
90
-
91
-
92
-
93
-
94
-
95
-
96
-
97
-
98
-
99
-
100
-
101
-
102
-
103
-
104
-
105
-
106
-
107
-
108
-
109
-
110
-
111
-
112
-
113
-
114
-
115
-
116
-
117
-
118
-
119
-
120
-
121
-
122
-
123
-
124
-
125
-
126
-
127
-
128
-
129
-
130
-
131
-
132
-
133
-
134
-
135
-
136
-
137
-
138
-
139
-
140
-
141
-
142
-
143
-
144
-
145
-
146
-
147
-
148
-
149
-
150
-
151
-
152
-
153
-
154
-
155
-
156
-
157
-
158
-
159
-
160
-
161
-
162
-
163
-
164
-
165
-
166
-
167
-
168
-
169
-
170
-
171
-
172
-
173
-
174
-
175
-
176
-
177
-
178
-
179
-
180
-
181
-
182
-
183
-
184
-
185
-
186
-
187
-
188
-
189
-
190
-
191
-
192
-
193
-
194
-
195
-
196
-
197
-
198
-
199
-
200
-
201
-
202
-
203
-
204
-
205
-
206
-
207
-
208
-
209
-
210
-
211
-
212
-
213
-
214
-
215
-
216
-
217
-
218
-
219
-
220
-
221
-
222
-
223
-
224
-
225
-
226
-
227
-
228
-
229
-
230
-
231
-
232
-
233
-
234
-
235
-
236
-
237
-
238
-
239
-
240
-
241
-
242
-
243
-
244
-
245
-
246
-
247
-
248
-
249
-
250
-
251
-
252
-
253
-
254
-
255
-
256
-
257
-
258
-
259
-
260
-
261
-
262
-
263
-
264
-
265
-
266
-
267
-
268
-
269
-
270
-
271
-
272
-
273
-
274
-
275
-
276
 |
 |

55
in particular. In addition, the size and persistency of gross profits from these businesses is an important driver of earnings as it affects
the rate of amortization of deferred policy acquisition costs.
Life’ s profitability in its individual life insurance and group benefits businesses depends largely on the size of its in-force block, the
adequacy of product pricing and underwriting discipline, actual mortality and morbidity experience, and the efficiency of its claims and
expense management.
Performance Measures
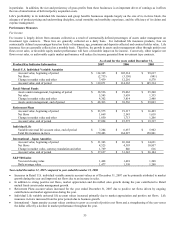
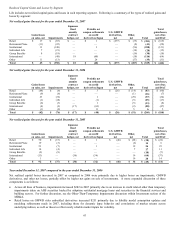
Fee Income
Fee income is largely driven from amounts collected as a result of contractually defined percentages of assets under management on
investment type contracts. These fees are generally collected on a daily basis. For individual life insurance products, fees are
contractually defined as percentages based on levels of insurance, age, premiums and deposits collected and contract holder value. Life
insurance fees are generally collected on a monthly basis. Therefore, the growth in assets under management either through positive net
flows or net sales, or favorable equity market performance will have a favorable impact on fee income. Conversely, either negative net
flows or net sales, or unfavorable equity market performance will reduce fee income generated from investment type contracts.
As of and for the years ended December 31,
Product/Key Indicator Information 2007 2006 2005
Retail U.S. Individual Variable Annuities
Account value, beginning of period $ 114,365 $ 105,314 $ 99,617
Net flows (2,733) (3,150) (881)
Change in market value and other 7,439 12,201 6,578
Account value, end of period $ 119,071 $ 114,365 $ 105,314
Retail Mutual Funds
Assets under management, beginning of period $ 38,536 $ 29,063 $ 25,240
Net sales 5,545 5,659 1,335
Change in market value and other 4,302 3,814 2,488
Assets under management, end of period $ 48,383 $ 38,536 $ 29,063
Retirement Plans
Account value, beginning of period $ 23,575 $ 19,317 $ 16,493
Net flows 1,669 2,545 1,618
Change in market value and other 1,850 1,713 1,206
Account value, end of period $ 27,094 $ 23,575 $ 19,317
Individual Life
Variable universal life account value, end of period $ 7,284 $ 6,637 $ 5,902
Total life insurance in-force 179,483 164,227 150,801
International - Japan Annuities
Account value, beginning of period $ 31,343 $ 26,104 $ 14,631
Net flows 4,525 4,393 10,857
Change in market value, currency translation and other 1,769 846 616
Account value, end of period $ 37,637 $ 31,343 $ 26,104
S&P 500 Index
Year end closing value 1,468 1,418 1,248
Daily average value 1,477 1,310 1,208
Year ended December 31, 2007 compared to year ended December 31, 2006
• Increases in Retail U.S. individual variable annuity account values as of December 31, 2007 can be primarily attributed to market
growth during the year and improved net flows due to an increase in sales.
• In addition to strong positive net flows, market appreciation and diversified sales growth during the year contributed to Retail
mutual funds assets under management growth.
• Retirement Plans account values increased for the year ended December 31, 2007 due to positive net flows driven by ongoing
contributions and market appreciation during the year.
• Individual Life variable universal life account values increased primarily due to market appreciation and positive net flows. Life
insurance in-force increased from the prior periods due to business growth.
• International - Japan annuity account values continue to grow as a result of positive net flows and a strengthening of the yen versus
the dollar offset by a decline in market performance throughout the year.