The Hartford 2007 Annual Report Download - page 31
Download and view the complete annual report
Please find page 31 of the 2007 The Hartford annual report below. You can navigate through the pages in the report by either clicking on the pages listed below, or by using the keyword search tool below to find specific information within the annual report.-
 1
1 -
2
-
3
-
4
-
5
-
6
-
7
-
8
-
9
-
10
-
11
-
12
-
13
-
14
-
15
-
16
-
17
-
18
-
19
-
20
-
 21
21 -
 22
22 -
 23
23 -
 24
24 -
 25
25 -
 26
26 -
 27
27 -
 28
28 -
 29
29 -
 30
30 -
 31
31 -
 32
32 -
 33
33 -
 34
34 -
 35
35 -
 36
36 -
 37
37 -
 38
38 -
 39
39 -
 40
40 -
 41
41 -
42
-
43
-
44
-
45
-
46
-
47
-
48
-
49
-
50
-
51
-
52
-
53
-
54
-
55
-
56
-
57
-
58
-
59
-
60
-
61
-
62
-
63
-
64
-
65
-
66
-
67
-
68
-
69
-
70
-
71
-
72
-
73
-
74
-
75
-
76
-
77
-
78
-
79
-
80
-
81
-
82
-
83
-
84
-
85
-
86
-
87
-
88
-
89
-
90
-
91
-
92
-
93
-
94
-
95
-
96
-
97
-
98
-
99
-
100
-
101
-
102
-
103
-
104
-
105
-
106
-
107
-
108
-
109
-
110
-
111
-
112
-
113
-
114
-
115
-
116
-
117
-
118
-
119
-
120
-
121
-
122
-
123
-
124
-
125
-
126
-
127
-
128
-
129
-
130
-
131
-
132
-
133
-
134
-
135
-
136
-
137
-
138
-
139
-
140
-
141
-
142
-
143
-
144
-
145
-
146
-
147
-
148
-
149
-
150
-
151
-
152
-
153
-
154
-
155
-
156
-
157
-
158
-
159
-
160
-
161
-
162
-
163
-
164
-
165
-
166
-
167
-
168
-
169
-
170
-
171
-
172
-
173
-
174
-
175
-
176
-
177
-
178
-
179
-
180
-
181
-
182
-
183
-
184
-
185
-
186
-
187
-
188
-
189
-
190
-
191
-
192
-
193
-
194
-
195
-
196
-
197
-
198
-
199
-
200
-
201
-
202
-
203
-
204
-
205
-
206
-
207
-
208
-
209
-
210
-
211
-
212
-
213
-
214
-
215
-
216
-
217
-
218
-
219
-
220
-
221
-
222
-
223
-
224
-
225
-
226
-
227
-
228
-
229
-
230
-
231
-
232
-
233
-
234
-
235
-
236
-
237
-
238
-
239
-
240
-
241
-
242
-
243
-
244
-
245
-
246
-
247
-
248
-
249
-
250
-
251
-
252
-
253
-
254
-
255
-
256
-
257
-
258
-
259
-
260
-
261
-
262
-
263
-
264
-
265
-
266
-
267
-
268
-
269
-
270
-
271
-
272
-
273
-
274
-
275
-
276
 |
 |

31
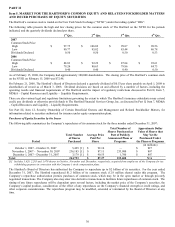
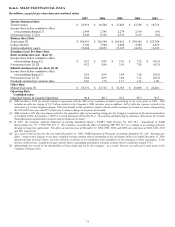
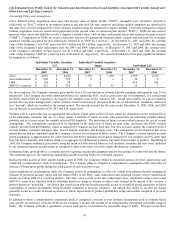
Item 6. SELECTED FINANCIAL DATA
(In millions, except for per share data and combined ratios)
2007 2006 2005 2004 2003
Income Statement Data
Total revenues $25,916 $26,500 $27,083 $ 22,708 $18,719
Income (loss) before cumulative effect
of accounting changes [1]
2,949
2,745
2,274
2,138
(91)
Net income (loss) [1] [2] 2,949 2,745 2,274 2,115 (91)
Balance Sheet Data
Total assets [3] $360,361 $326,544 $285,412 $ 259,585 $225,764
Long-term debt 3,142 3,504 4,048 4,308 4,610
Total stockholders’ equity 19,204 18,876 15,325 14,238 11,639
Earnings (Loss) Per Share Data
Basic earnings (loss) per share [1]
Income (loss) before cumulative effect
of accounting change [1]
$
9.32
$
8.89
$
7.63
$
7.32
$
(0.33)
Net income (loss) [1] [2] 9.32 8.89 7.63 7.24 (0.33)
Diluted earnings (loss) per share [1] [4]
Income (loss) before cumulative effect
of accounting change [1]
9.24
8.69
7.44
7.20
(0.33)
Net income (loss) [1] [2] 9.24 8.69 7.44 7.12 (0.33)
Dividends declared per common share 2.03 1.70 1.17 1.13 1.09
Other Data
Mutual fund assets [5] $ 55,531 $ 43,732 $ 32,705 $ 28,068 $ 22,462
Operating Data
Combined ratios
Ongoing Property & Casualty Operations 90.8 89.3 93.2 95.3 96.5
[1] 2004 includes a $216 tax benefit related to agreement with the IRS on the resolution of matters pertaining to tax years prior to 2004. 2003
includes an after-tax charge of $1.7 billion related to the Company’s 2003 asbestos reserve addition, $40 of after-tax expense related to the
settlement of a certain litigation dispute, $30 of tax benefit in Life primarily related to the favorable treatment of certain tax items arising during
the 1996-2002 tax years, and $27 of after-tax severance charges in Property & Casualty.
[2] 2004 includes a $23 after-tax charge related to the cumulative effect of accounting change for the Company’s adoption of the American Institute
of Certified Public Accountants (“AICPA”) issued Statement of Position 03-1, "Accounting and Reporting by Insurance Enterprises for Certain
Nontraditional Long-Duration Contracts and for Separate Accounts”.
[3] In 2007, the Company adopted Financial Accounting Standards Board (“FASB”) Staff Position No. FIN 39-1, “Amendment of FASB
Interpretation No. 39” (“FSP FIN 39-1”). The Company recorded the effect of adopting FSP FIN 39-1 as a change in accounting principle
through retrospective application. The effect on total assets as of December 31, 2006, 2005, 2004, and 2003 was a decrease of $166, $145, $150
and $86, respectively.
[4] As a result of the net loss for the year ended December 31, 2003, FASB Statement of Financial Accounting Standards No. 128, “Earnings per
Share” requires the Company to use basic weighted average common shares outstanding in the calculation of the year ended December 31, 2003
diluted earnings (loss) per share, since the inclusion of options of 1.8 would have been antidilutive to the earnings per share calculation. In the
absence of the net loss, weighted average common shares outstanding and dilutive potential common shares would have totaled 274.2.
[5] Mutual funds are owned by the shareholders of those funds and not by the Company. As a result, they are not reflected in total assets in the
Company’s balance sheet.