The Hartford 2007 Annual Report Download - page 168
Download and view the complete annual report
Please find page 168 of the 2007 The Hartford annual report below. You can navigate through the pages in the report by either clicking on the pages listed below, or by using the keyword search tool below to find specific information within the annual report.-
 1
1 -
2
-
3
-
4
-
5
-
6
-
7
-
8
-
9
-
10
-
11
-
12
-
13
-
14
-
15
-
16
-
17
-
18
-
19
-
20
-
21
-
22
-
23
-
24
-
25
-
26
-
27
-
28
-
29
-
30
-
31
-
32
-
33
-
34
-
35
-
36
-
37
-
38
-
39
-
40
-
41
-
42
-
43
-
44
-
45
-
46
-
47
-
48
-
49
-
50
-
51
-
52
-
53
-
54
-
55
-
56
-
57
-
58
-
59
-
60
-
61
-
62
-
63
-
64
-
65
-
66
-
67
-
68
-
69
-
70
-
71
-
72
-
73
-
74
-
75
-
76
-
77
-
78
-
79
-
80
-
81
-
82
-
83
-
84
-
85
-
86
-
87
-
88
-
89
-
90
-
91
-
92
-
93
-
94
-
95
-
96
-
97
-
98
-
99
-
100
-
101
-
102
-
103
-
104
-
105
-
106
-
107
-
108
-
109
-
110
-
111
-
112
-
113
-
114
-
115
-
116
-
117
-
118
-
119
-
120
-
121
-
122
-
123
-
124
-
125
-
126
-
127
-
128
-
129
-
130
-
131
-
132
-
133
-
134
-
135
-
136
-
137
-
138
-
139
-
140
-
141
-
142
-
143
-
144
-
145
-
146
-
147
-
148
-
149
-
150
-
151
-
152
-
153
-
154
-
155
-
156
-
157
-
 158
158 -
 159
159 -
 160
160 -
 161
161 -
 162
162 -
 163
163 -
 164
164 -
 165
165 -
 166
166 -
 167
167 -
 168
168 -
 169
169 -
 170
170 -
 171
171 -
 172
172 -
 173
173 -
 174
174 -
 175
175 -
 176
176 -
 177
177 -
 178
178 -
179
-
180
-
181
-
182
-
183
-
184
-
185
-
186
-
187
-
188
-
189
-
190
-
191
-
192
-
193
-
194
-
195
-
196
-
197
-
198
-
199
-
200
-
201
-
202
-
203
-
204
-
205
-
206
-
207
-
208
-
209
-
210
-
211
-
212
-
213
-
214
-
215
-
216
-
217
-
218
-
219
-
220
-
221
-
222
-
223
-
224
-
225
-
226
-
227
-
228
-
229
-
230
-
231
-
232
-
233
-
234
-
235
-
236
-
237
-
238
-
239
-
240
-
241
-
242
-
243
-
244
-
245
-
246
-
247
-
248
-
249
-
250
-
251
-
252
-
253
-
254
-
255
-
256
-
257
-
258
-
259
-
260
-
261
-
262
-
263
-
264
-
265
-
266
-
267
-
268
-
269
-
270
-
271
-
272
-
273
-
274
-
275
-
276
 |
 |

168
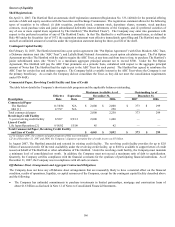
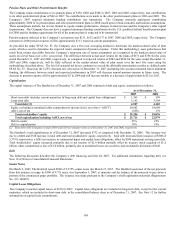
Pension Plans and Other Postretirement Benefits
The Company made contributions to its pension plans of $158, $402 and $504 in 2007, 2006 and 2005, respectively, and contributions
to its other postretirement plans of $46 in 2007. No contributions were made to the other postretirement plans in 2006 and 2005. The
Company’s 2007 required minimum funding contribution was immaterial. The Company presently anticipates contributing
approximately $200 to its pension plans and other postretirement plans in 2008, based upon certain economic and business assumptions.
These assumptions include, but are not limited to, equity market performance, changes in interest rates and the Company’ s other capital
requirements. The Company does not have a required minimum funding contribution for the U.S. qualified defined benefit pension plan
for 2008 and the funding requirements for all of the pension plans is expected to be immaterial.
Pension expense reflected in the Company’ s net income was $131, $152 and $137 in 2007, 2006 and 2005, respectively. The Company
estimates its 2008 pension expense will be approximately $113, based on current assumptions.
As provided for under SFAS No. 87, the Company uses a five-year averaging method to determine the market-related value of plan
assets, which is used to determine the expected return component of pension expense. Under this methodology, asset gains/losses that
result from returns that differ from the Company’ s long-term rate of return assumption are recognized in the market-related value of
assets on a level basis over a five year period. The difference between actual asset returns for the plans of $331 and $356 for the years
ended December 31, 2007 and 2006, respectively, as compared to expected returns of $283 and $244 for the years ended December 31,
2007 and 2006, respectively, will be fully reflected in the market-related value of plan assets over the next five years using the
methodology described above. The level of actuarial net losses continues to exceed the allowable amortization corridor as defined under
SFAS No. 87. Based on the 6.25% discount rate selected as of December 31, 2007 and taking into account estimated future minimum
funding, the difference between actual and expected performance in 2007 will decrease annual pension expense in future years. The
decrease in pension expense will be approximately $2 in 2008 and will increase ratably to a decrease of approximately $12 in 2013.
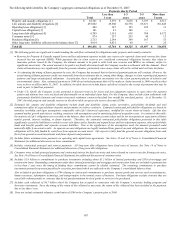
Capitalization
The capital structure of The Hartford as of December 31, 2007 and 2006 consisted of debt and equity, summarized as follows:
As of December 31,
2007 2006
Short-term debt (includes current maturities of long-term debt and capital lease obligations) $ 1,365 $599
Long-term debt 3,142 3,504
Total debt [1] 4,507 4,103
Equity excluding accumulated other comprehensive income (loss), net of tax (“AOCI”) 20,062 18,698
AOCI, net of tax (858) 178
Total stockholders’ equity $ 19,204 $18,876
Total capitalization including AOCI, net of tax $ 23,711 $22,979
Debt to equity 23% 22%
Debt to capitalization 19% 18%
[1] Total debt of the Company excludes $809 and $258 of consumer notes as of December 31, 2007 and 2006, respectively.
The Hartford’ s total capitalization as of December 31, 2007 increased $732 as compared with December 31, 2006. This increase was
due to a $404 and $328 increase in total debt and total stockholders’ equity, respectively. Total debt increased from issuance of $500 of
5.375% senior notes, a $202 net increase in commercial paper and capital lease obligations, offset by $300 repayment on long-term debt.
Total stockholders’ equity increased primarily due to net income of $2.9 billion partially offset by treasury stock acquired of $1.2
billion, other comprehensive loss of $1.0 billion, primarily due to unrealized losses on securities, and stockholder dividends of $643.
Debt
The following discussion describes the Company’ s debt financing activities for 2007. For additional information regarding debt, see
Note 14 of Notes to Consolidated Financial Statements.
Senior Notes
On March 9, 2007, The Hartford issued $500 of 5.375% senior notes due March 15, 2017. The Hartford used most of the net proceeds
from this issuance to repay its $300 of 4.7% notes, due September 1, 2007, at maturity and the balance of the proceeds to pay down a
portion of the commercial paper portfolio. The issuance was made pursuant to the Company’ s shelf registration statement (Registration
No. 333-108067).
Capital Lease Obligations
The Company recorded capital leases of $128 in 2007. Capital lease obligations are included in long-term debt, except for the current
maturities, which are included in short-term debt, in the consolidated balance sheet as of December 31, 2007. See Note 12 for further
information on capital lease commitments.