The Hartford 2007 Annual Report Download - page 138
Download and view the complete annual report
Please find page 138 of the 2007 The Hartford annual report below. You can navigate through the pages in the report by either clicking on the pages listed below, or by using the keyword search tool below to find specific information within the annual report.
138
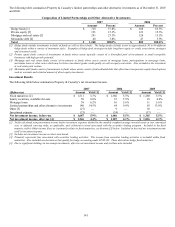
Investment Results
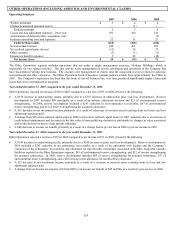
The following table summarizes Life’ s net investment income.
2007 2006 2005
(Before-tax) Amount Yield [1] Amount Yield [1] Amount Yield [1]
Fixed maturities [2] $3,114 5.9% $ 2,860 5.8% $ 2,659 5.7%
Equity securities, available-for-sale 86 7.0% 56 7.3% 40 5.8%
Mortgage loans 255 6.2% 142 6.3% 73 6.4%
Limited partnerships and other alternative investments 115 12.0% 69 12.6% 59 20.2%
Policy loans 135 6.5% 142 6.9% 144 6.8%
Other [3] (133) — (22) — 69 —
Investment expense (75) — (63) — (46) —
Total net investment income excluding equity
securities held for trading $3,497 6.0%
$3,184 5.8%
$2,998 5.7%
Equity securities held for trading [4] 145 1,824 3,847
Total net investment income $3,642 $ 5,008 $ 6,845
[1] Yields calculated using investment income before investment expenses (excluding income related to equity securities held for trading) divided by
the monthly weighted average invested assets at cost, amortized cost, or adjusted carrying value, as applicable excluding equity securities held for
trading, collateral received associated with the securities lending program and consolidated variable interest entity minority interests. Included
in the fixed maturity yield is Other income (loss) as it primarily relates to fixed maturities, see footnote [3] below. Included in the total net
investment income yield is investment expense.
[2] Includes net investment income on short-term bonds.
[3] Primarily represents fees associated with securities lending activities. The income from securities lending activities is included within fixed
maturities. Also included are derivatives that qualify for hedge accounting under SFAS 133. These derivatives hedge fixed maturities.
[4] Includes investment income and mark-to-market effects of equity securities, held for trading.
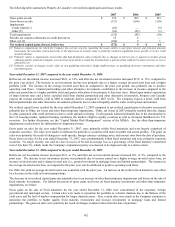
The following table summarizes Life’ s net realized capital gains and losses results.
(Before-tax) 2007 2006 2005
Gross gains on sale $213 $ 215 $346
Gross losses on sale (168) (257) (254)
Impairments
Credit related [1] (241) (10) (32)
Other [2] (117) (66) (5)
Total impairments (358) (76) (37)
Japanese fixed annuity contract hedges, net [3] 18 (17) (36)
Periodic net coupon settlements on credit derivatives/Japan (40) (48) (32)
U.S. GMWB derivatives, net (277) (26) (46)
Other, net [4] (207) (51) 34
Net realized capital losses, before-tax $(819) $ (260) $(25)
[1] Relates to impairments for which the Company has current concerns regarding the issuers ability to pay future interest and principal amounts
based upon the securities contractual terms or the depression in security value is primarily related to significant issuer specific or sector credit
spread widening.
[2] Primarily relates to impairments of securities that had declined in value primarily due to changes in interest rate or general or modest spread
widening and for which the Company was uncertain of its intent to retain the investment for a period of time sufficient to allow recovery to cost or
amortized cost.
[3] Relates to the Japanese fixed annuity product (product and related derivative hedging instruments excluding periodic net coupon settlements).
[4] Primarily consists of changes in fair value on non-qualifying derivatives and hedge ineffectiveness on qualifying derivative instruments and other
investment gains.
Year ended December 31, 2007 compared to the year ended December 31, 2006
Net investment income, excluding securities held for trading, increased $313, or 10%, for the year ended December 31, 2007, compared
to the prior year period. The increase in net investment income was primarily due to a higher average invested asset base and a higher
total portfolio yield. The increase in the average invested assets base as compared to the prior year, was primarily due to positive
operating cash flows, investment contract sales such as retail and institutional notes, and universal life-type product sales. Limited
partnerships and other alternative investments contributed to the increase in income compared to the prior year period, despite a lower
yield, due to a greater allocation of investments to this asset class. While the limited partnership and other alternative investment yield
continues to exceed the overall portfolio yield, it decreased for the current year ended compared to the prior year ended primarily due to
the market performance of Life’ s hedge fund investments largely due to disruptions in the credit market associated with structured
securities. Also included in limited partnerships and other alternative assets was a decrease in value of $11 on a real estate joint venture
due to the decline of the real estate market in which the property was located. Based upon market expectation of future interest rates


