The Hartford 2007 Annual Report Download - page 73
Download and view the complete annual report
Please find page 73 of the 2007 The Hartford annual report below. You can navigate through the pages in the report by either clicking on the pages listed below, or by using the keyword search tool below to find specific information within the annual report.-
 1
1 -
2
-
3
-
4
-
5
-
6
-
7
-
8
-
9
-
10
-
11
-
12
-
13
-
14
-
15
-
16
-
17
-
18
-
19
-
20
-
21
-
22
-
23
-
24
-
25
-
26
-
27
-
28
-
29
-
30
-
31
-
32
-
33
-
34
-
35
-
36
-
37
-
38
-
39
-
40
-
41
-
42
-
43
-
44
-
45
-
46
-
47
-
48
-
49
-
50
-
51
-
52
-
53
-
54
-
55
-
56
-
57
-
58
-
59
-
60
-
61
-
62
-
 63
63 -
 64
64 -
 65
65 -
 66
66 -
 67
67 -
 68
68 -
 69
69 -
 70
70 -
 71
71 -
 72
72 -
 73
73 -
 74
74 -
 75
75 -
 76
76 -
 77
77 -
 78
78 -
 79
79 -
 80
80 -
 81
81 -
 82
82 -
 83
83 -
84
-
85
-
86
-
87
-
88
-
89
-
90
-
91
-
92
-
93
-
94
-
95
-
96
-
97
-
98
-
99
-
100
-
101
-
102
-
103
-
104
-
105
-
106
-
107
-
108
-
109
-
110
-
111
-
112
-
113
-
114
-
115
-
116
-
117
-
118
-
119
-
120
-
121
-
122
-
123
-
124
-
125
-
126
-
127
-
128
-
129
-
130
-
131
-
132
-
133
-
134
-
135
-
136
-
137
-
138
-
139
-
140
-
141
-
142
-
143
-
144
-
145
-
146
-
147
-
148
-
149
-
150
-
151
-
152
-
153
-
154
-
155
-
156
-
157
-
158
-
159
-
160
-
161
-
162
-
163
-
164
-
165
-
166
-
167
-
168
-
169
-
170
-
171
-
172
-
173
-
174
-
175
-
176
-
177
-
178
-
179
-
180
-
181
-
182
-
183
-
184
-
185
-
186
-
187
-
188
-
189
-
190
-
191
-
192
-
193
-
194
-
195
-
196
-
197
-
198
-
199
-
200
-
201
-
202
-
203
-
204
-
205
-
206
-
207
-
208
-
209
-
210
-
211
-
212
-
213
-
214
-
215
-
216
-
217
-
218
-
219
-
220
-
221
-
222
-
223
-
224
-
225
-
226
-
227
-
228
-
229
-
230
-
231
-
232
-
233
-
234
-
235
-
236
-
237
-
238
-
239
-
240
-
241
-
242
-
243
-
244
-
245
-
246
-
247
-
248
-
249
-
250
-
251
-
252
-
253
-
254
-
255
-
256
-
257
-
258
-
259
-
260
-
261
-
262
-
263
-
264
-
265
-
266
-
267
-
268
-
269
-
270
-
271
-
272
-
273
-
274
-
275
-
276
 |
 |

73
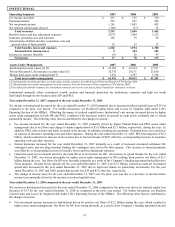
INTERNATIONAL
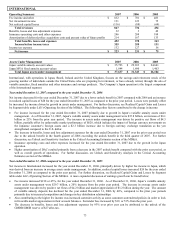
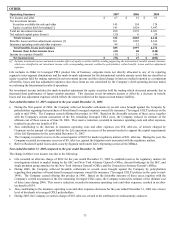
Operating Summary 2007 2006 2005
Fee income and other $832 $ 701 $483
Net investment income 131 123 75
Net realized capital losses (116) (88) (64)
Total revenues 847 736 494
Benefits, losses and loss adjustment expenses 32 3 42
Insurance operating costs and other expenses 246 208 188
Amortization of deferred policy acquisition costs and present value of future profits 214 167 133
Total benefits, losses and expenses 492 378 363
Income before income taxes 355 358 131
Income tax expense 132 127 56
Net income $223 $ 231 $75
Assets Under Management 2007 2006 2005
Japan variable annuity account values $35,793 $ 29,653 $24,641
Japan MVA fixed annuity account values 1,844 1,690 1,463
Total Japan assets under management $37,637 $ 31,343 $26,104
International, with operations in Japan, Brazil, Ireland and the United Kingdom, focuses on the savings and retirement needs of the
growing number of individuals outside the United States who are preparing for retirement, or have already retired, through the sale of
variable annuities, fixed annuities and other insurance and savings products. The Company’ s Japan operation is the largest component
of the International segment.
Year ended December 31, 2007 compared to the year ended December 31, 2006
Net income decreased for the year ended December 31, 2007 due to a lower unlock benefit in 2007 compared with 2006 and an increase
in realized capital losses of $28 for the year ended December 31, 2007 as compared to the prior year period. Losses were partially offset
by increased fee income driven by growth in assets under management. For further discussion, see Realized Capital Gains and Losses
by Segment table under Life’s Operating Section of the MD&A. The following other factors contributed to the change in income:
• Fee income increased for the year ended December 31, 2007 primarily due to growth in Japan’s variable annuity assets under
management. As of December 31, 2007, Japan’ s variable annuity assets under management were $35.8 billion, an increase of $6.1
billion or 21% from the prior year period. The increase in assets under management was driven by positive net flows of $4.5
billion, partially offset by unfavorable market performance of $620, which includes the impact of foreign currency movements on
the Japanese customer’ s foreign assets and a $2.3 billion increase due to foreign currency exchange translation as the yen
strengthened compared to the U.S. dollar.
• The increase in benefits, losses and loss adjustment expenses for the year ended December 31, 2007 over the prior year period was
due to the unlock benefit in the fourth quarter of 2006 exceeding the unlock benefit in the third quarter of 2007. For further
discussion, see Unlock and Sensitivity Analysis in the Critical Accounting Estimates section of the MD&A.
• Insurance operating costs and other expenses increased for the year ended December 31, 2007 due to the growth in the Japan
operation.
• Higher amortization of DAC resulted primarily from a decrease in the 2007 unlock benefit compared with the prior year period, as
well as overall growth of operations. For further discussion, see Unlock and Sensitivity Analysis in the Critical Accounting
Estimates section of the MD&A.
Year ended December 31, 2006 compared to the year ended December 31, 2005
Net income in International increased for the year ended December 31, 2006, principally driven by higher fee income in Japan, which
was derived from an increase in average assets under management. In addition, realized capital losses increased $24 for the year ended
December 31, 2006 as compared to the prior year period. For further discussion, see Realized Capital Gains and Losses by Segment
table under Life’ s Operating Section of the MD&A. A more expanded discussion of earnings growth can be found below:
• Fee income increased $218 or 45%, for the year ended December 31, 2006. As of December 31, 2006, Japan’ s variable annuity
assets under management were $29.7 billion, a 20% increase from the prior year period. The increase in average assets under
management was driven by positive net flows of $4.2 billion and market appreciation of $1.2 billion during the year. The amount
of variable annuity deposits has declined for the year ended December 31, 2006 by 46%, compared to the prior year periods
primarily due to increased competition and changes in key distribution relationships.
• Also contributing to the higher fee income was increased surrender activity as some customers surrendered policies in order to lock
in favorable market appreciation in their account balances. Surrender fees increased by $19, or 53% from the prior year.
• The decrease in benefits, losses and loss adjustment expenses by 93% over prior year can be attributed to the unlock of the
GMDB/GMIB reserve of $27 after-tax.