The Hartford 2007 Annual Report Download - page 154
Download and view the complete annual report
Please find page 154 of the 2007 The Hartford annual report below. You can navigate through the pages in the report by either clicking on the pages listed below, or by using the keyword search tool below to find specific information within the annual report.-
 1
1 -
2
-
3
-
4
-
5
-
6
-
7
-
8
-
9
-
10
-
11
-
12
-
13
-
14
-
15
-
16
-
17
-
18
-
19
-
20
-
21
-
22
-
23
-
24
-
25
-
26
-
27
-
28
-
29
-
30
-
31
-
32
-
33
-
34
-
35
-
36
-
37
-
38
-
39
-
40
-
41
-
42
-
43
-
44
-
45
-
46
-
47
-
48
-
49
-
50
-
51
-
52
-
53
-
54
-
55
-
56
-
57
-
58
-
59
-
60
-
61
-
62
-
63
-
64
-
65
-
66
-
67
-
68
-
69
-
70
-
71
-
72
-
73
-
74
-
75
-
76
-
77
-
78
-
79
-
80
-
81
-
82
-
83
-
84
-
85
-
86
-
87
-
88
-
89
-
90
-
91
-
92
-
93
-
94
-
95
-
96
-
97
-
98
-
99
-
100
-
101
-
102
-
103
-
104
-
105
-
106
-
107
-
108
-
109
-
110
-
111
-
112
-
113
-
114
-
115
-
116
-
117
-
118
-
119
-
120
-
121
-
122
-
123
-
124
-
125
-
126
-
127
-
128
-
129
-
130
-
131
-
132
-
133
-
134
-
135
-
136
-
137
-
138
-
139
-
140
-
141
-
142
-
143
-
 144
144 -
 145
145 -
 146
146 -
 147
147 -
 148
148 -
 149
149 -
 150
150 -
 151
151 -
 152
152 -
 153
153 -
 154
154 -
 155
155 -
 156
156 -
 157
157 -
 158
158 -
 159
159 -
 160
160 -
 161
161 -
 162
162 -
 163
163 -
 164
164 -
165
-
166
-
167
-
168
-
169
-
170
-
171
-
172
-
173
-
174
-
175
-
176
-
177
-
178
-
179
-
180
-
181
-
182
-
183
-
184
-
185
-
186
-
187
-
188
-
189
-
190
-
191
-
192
-
193
-
194
-
195
-
196
-
197
-
198
-
199
-
200
-
201
-
202
-
203
-
204
-
205
-
206
-
207
-
208
-
209
-
210
-
211
-
212
-
213
-
214
-
215
-
216
-
217
-
218
-
219
-
220
-
221
-
222
-
223
-
224
-
225
-
226
-
227
-
228
-
229
-
230
-
231
-
232
-
233
-
234
-
235
-
236
-
237
-
238
-
239
-
240
-
241
-
242
-
243
-
244
-
245
-
246
-
247
-
248
-
249
-
250
-
251
-
252
-
253
-
254
-
255
-
256
-
257
-
258
-
259
-
260
-
261
-
262
-
263
-
264
-
265
-
266
-
267
-
268
-
269
-
270
-
271
-
272
-
273
-
274
-
275
-
276
 |
 |

154
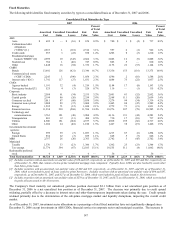
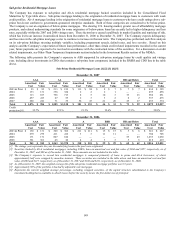
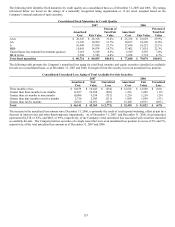
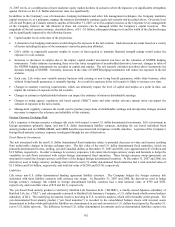
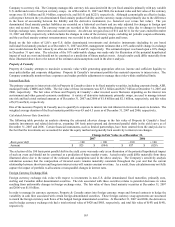
Consolidated Total Available-for-Sale Securities with Unrealized Loss Greater Than Six Months by Type
2007 2006
Amortized
Cost
Fair
Value
Unrealized
Loss
Percent of
Total
Unrealized
Loss
Amortized
Cost
Fair
Value
Unrealized
Loss
Percent of
Total
Unrealized
Loss
ABS
Aircraft lease receivables $ 99 $ 79 $ (20) 1.4% $ 107 $ 79 $ (28) 5.1%
CDOs 514 490 (24) 1.7% 133 129 (4) 0.7%
RMBS 781 677 (104) 7.2% 224 216 (8) 1.4%
Other ABS 865 814 (51) 3.6% 715 704 (11) 2.0%
CMBS
Bonds 5,926 5,679 (247) 17.2% 3,987 3,887 (100) 18.1%
CRE CDOs 1,279 1,010 (269) 18.8% 252 247 (5) 0.9%
IOs 287 272 (15) 1.0% 443 429 (14) 2.5%
Corporate
Basic industry 625 604 (21) 1.5% 859 834 (25) 4.5%
Consumer cyclical 682 651 (31) 2.2% 752 724 (28) 5.1%
Consumer non-cyclical 881 854 (27) 1.9% 1,106 1,068 (38) 6.9%
Financial services 4,002 3,670 (332) 23.1% 2,749 2,689 (60) 10.8%
Technology and communications 611 590 (21) 1.5% 912 877 (35) 6.3%
Transportation 140 132 (8) 0.6% 225 216 (9) 1.6%
Utilities 1,555 1,477 (78) 5.4% 1,384 1,331 (53) 9.6%
Other 1,311 1,258 (53) 3.7% 1,454 1,404 (50) 9.1%
MBS 1,051 1,031 (20) 1.4% 1,793 1,748 (45) 8.1%
Municipals 2,026 1,965 (61) 4.2% 490 473 (17) 3.1%
Other securities 770 717 (53) 3.6% 1,048 1,025 (23) 4.2%
Total $ 23,405 $ 21,970 $ (1,435) 100.0% $ 18,633 $ 18,080 $ (553) 100.0%
The increase in total unrealized losses greater than six months since December 31, 2006 primarily resulted from credit spread widening,
offset in part by the decreases in interest rates and other-than-temporary impairments. The sectors with the most significant
concentration of unrealized losses were CMBS and corporate fixed maturities most significantly within the financial services sector.
The Company’ s current view of risk factors relative to these fixed maturity types is as follows:
CMBS — As of December 31, 2007, the Company held approximately 720 different securities that had been in an unrealized loss
position for greater than six months. Approximately 50 securities were priced at or less than 80% of amortized cost as of December 31,
2007, however the price depressions primarily occurred during the fourth quarter and pertained to securities rated AA and above. The
recent price depression resulted from widening credit spreads primarily due to tightened lending conditions and the market’ s flight to
quality securities. See the “Commercial Mortgage Loans” commentary and tables above. Future changes in fair value of these
securities are primarily dependent upon sector fundamentals, credit spread movements, and changes in interest rates.
Financial services — As of December 31, 2007, the Company held approximately 230 different securities in the financial services
sector that were in an unrealized loss position for greater than six months. Substantially all of these securities are rated investment
grade securities, most of which are priced at, or greater than, 90% of amortized cost as of December 31, 2007. The increase in
unrealized losses was primarily due to the recent credit spread widening stemming from concerns over risks in the sub-prime mortgage
and leveraged finance markets and the associated impact of issuer credit losses, earnings volatility, and access to liquidity for companies
involved in those markets as well as the financial sector as a whole. Future changes in fair value of these securities are primarily
dependent on the extent of future issuer credit losses, return of liquidity, and changes in general market conditions, including interest
rates and credit spread movements.
RMBS — As of December 31, 2007, the Company held approximately 100 different securities that had been in an unrealized loss
position for greater than six months, of which 80% were rated AA and above. The remaining securities primarily consist of securities
from vintage years 2005 and prior. Fundamentals impacting the RMBS market, as discussed in the “Sub-prime Residential Mortgage
Loans” section above have caused a pull-back in market liquidity and repricing of risk. Future changes in fair value of these securities
are primarily dependent upon sector fundamentals and credit spread movements.
As part of the Company’s ongoing security monitoring process by a committee of investment and accounting professionals, the
Company has reviewed its investment portfolio and concluded that there were no additional other-than-temporary impairments as of
December 31, 2007 and 2006. Due to the issuers’ continued satisfaction of the securities’ obligations in accordance with their
contractual terms and the expectation that they will continue to do so, management’ s intent and ability to hold these securities to
recovery, as well as the evaluation of the fundamentals of the issuers’ financial condition and other objective evidence, the Company
believes that the prices of the securities in the sectors identified above were temporarily depressed.