The Hartford 2007 Annual Report Download - page 77
Download and view the complete annual report
Please find page 77 of the 2007 The Hartford annual report below. You can navigate through the pages in the report by either clicking on the pages listed below, or by using the keyword search tool below to find specific information within the annual report.-
 1
1 -
2
-
3
-
4
-
5
-
6
-
7
-
8
-
9
-
10
-
11
-
12
-
13
-
14
-
15
-
16
-
17
-
18
-
19
-
20
-
21
-
22
-
23
-
24
-
25
-
26
-
27
-
28
-
29
-
30
-
31
-
32
-
33
-
34
-
35
-
36
-
37
-
38
-
39
-
40
-
41
-
42
-
43
-
44
-
45
-
46
-
47
-
48
-
49
-
50
-
51
-
52
-
53
-
54
-
55
-
56
-
57
-
58
-
59
-
60
-
61
-
62
-
63
-
64
-
65
-
66
-
 67
67 -
 68
68 -
 69
69 -
 70
70 -
 71
71 -
 72
72 -
 73
73 -
 74
74 -
 75
75 -
 76
76 -
 77
77 -
 78
78 -
 79
79 -
 80
80 -
 81
81 -
 82
82 -
 83
83 -
 84
84 -
 85
85 -
 86
86 -
 87
87 -
88
-
89
-
90
-
91
-
92
-
93
-
94
-
95
-
96
-
97
-
98
-
99
-
100
-
101
-
102
-
103
-
104
-
105
-
106
-
107
-
108
-
109
-
110
-
111
-
112
-
113
-
114
-
115
-
116
-
117
-
118
-
119
-
120
-
121
-
122
-
123
-
124
-
125
-
126
-
127
-
128
-
129
-
130
-
131
-
132
-
133
-
134
-
135
-
136
-
137
-
138
-
139
-
140
-
141
-
142
-
143
-
144
-
145
-
146
-
147
-
148
-
149
-
150
-
151
-
152
-
153
-
154
-
155
-
156
-
157
-
158
-
159
-
160
-
161
-
162
-
163
-
164
-
165
-
166
-
167
-
168
-
169
-
170
-
171
-
172
-
173
-
174
-
175
-
176
-
177
-
178
-
179
-
180
-
181
-
182
-
183
-
184
-
185
-
186
-
187
-
188
-
189
-
190
-
191
-
192
-
193
-
194
-
195
-
196
-
197
-
198
-
199
-
200
-
201
-
202
-
203
-
204
-
205
-
206
-
207
-
208
-
209
-
210
-
211
-
212
-
213
-
214
-
215
-
216
-
217
-
218
-
219
-
220
-
221
-
222
-
223
-
224
-
225
-
226
-
227
-
228
-
229
-
230
-
231
-
232
-
233
-
234
-
235
-
236
-
237
-
238
-
239
-
240
-
241
-
242
-
243
-
244
-
245
-
246
-
247
-
248
-
249
-
250
-
251
-
252
-
253
-
254
-
255
-
256
-
257
-
258
-
259
-
260
-
261
-
262
-
263
-
264
-
265
-
266
-
267
-
268
-
269
-
270
-
271
-
272
-
273
-
274
-
275
-
276
 |
 |

77
• Middle Market earned premium decreased by $103, or 4%, driven by decreases in all lines, including commercial auto, general
liability, workers’ compensation and property. Earned premium decreases were driven by declines in earned pricing and premium
renewal retention in all lines and a decline in new business premiums in all lines except workers’ compensation.
• Specialty Commercial earned premium decreased by $47, or 3%, primarily driven by a decrease in casualty and property and a
decrease in earned premiums assumed under inter-segment arrangements, partially offset by an increase in professional liability,
fidelity and surety.
Year ended December 31, 2006 compared to the year ended December 31, 2005
• Total Property & Casualty earned premiums grew $277, or 3%, due primarily to growth in Personal Lines, Small Commercial and
Middle Market, partially offset by a decrease in Specialty Commercial. Contributing to the growth in earned premium was a $73
reduction of earned premium in 2005 due to catastrophe treaty reinstatement premium payable to reinsurers as a result of losses
from hurricanes Katrina, Rita and Wilma, including $31 in Personal Lines, $7 in Small Commercial, $8 in Middle Market and $27
in Specialty Commercial. Before catastrophe treaty reinstatement premium, Ongoing Operations’ earned premium grew $203, or
2%, for 2006.
• For the year ended December 31, 2006, earned premiums grew $231, or 10%, in Small Commercial, $150, or 4%, in Personal Lines
and $99, or 4%, in Middle Market. Apart from the effect of catastrophe treaty reinstatement premium in 2005, the growth was
primarily driven by new business premium outpacing non-renewals over the last six months of 2005 and the full year of 2006 and
the effect of earned pricing increases in homeowners, partially offset by the effect of higher property catastrophe treaty reinsurance
costs and earned pricing decreases in Middle Market.
• Specialty Commercial earned premiums decreased by $204, or 12%, primarily driven by a decrease in casualty, property and other
earned premiums, partially offset by an increase in professional liability, fidelity and surety. Casualty earned premiums decreased
by $217, primarily because of the non-renewal of a single captive insurance program. The decrease in property earned premium
was primarily due to a decline in new business, an increase in catastrophe treaty reinsurance costs and a strategic decision not to
renew certain accounts with properties in catastrophe-prone areas.
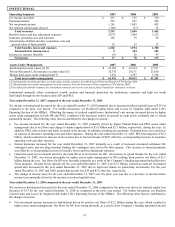
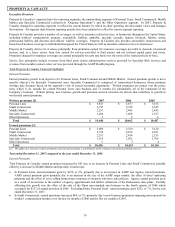
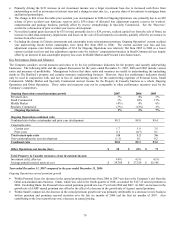
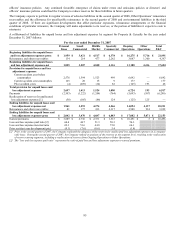
Net income
2007 2006 2005
Underwriting results $ 759 $745 $ 465
Net servicing and other income [1] 52 53 49
Net investment income 1,687 1,486 1,365
Other expenses (249) (223) (203)
Net realized capital gains (losses) (172) 9 44
Income before income taxes 2,077 2,070 1,720
Income tax expense (570) (551) (484)
Net income $ 1,507 $1,519 $ 1,236
[1] Net of expenses related to service business.
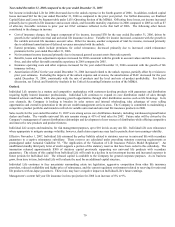
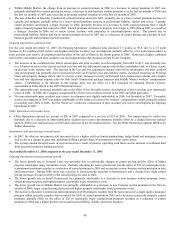
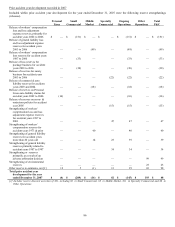
Year ended December 31, 2007 compared to the year ended December 31, 2006
Net income decreased by $12, or 1%, for the year ended December 31, 2007, driven by the following changes:
Income
before
income tax
Net
income
2006 $ 2,070 $ 1,519
Excluding Omni, a decrease in Ongoing Operations’ current accident year underwriting results before
catastrophes
(267) (174)
A change to net realized capital losses (181) (158)
An increase in net investment income 201 139
A decrease in Other Operations’ net unfavorable prior accident year reserve development 167 110
An increase in net favorable prior accident year reserve development in Ongoing Operations 81 52
An increase in other expenses (26) (17)
Benefit from a tax true-up — 20
An increase in current accident year underwriting results due to the sale of the Omni non-standard auto
business, which generated a current accident year underwriting loss before catastrophes in 2006
22
14
A decrease in current accident year catastrophe losses 22 14
Other changes, net (12) (12)
Net change in income for 2007 7 (12)
2007 $ 2,077 $ 1,507