The Hartford 2007 Annual Report Download - page 192
Download and view the complete annual report
Please find page 192 of the 2007 The Hartford annual report below. You can navigate through the pages in the report by either clicking on the pages listed below, or by using the keyword search tool below to find specific information within the annual report.-
 1
1 -
2
-
3
-
4
-
5
-
6
-
7
-
8
-
9
-
10
-
11
-
12
-
13
-
14
-
15
-
16
-
17
-
18
-
19
-
20
-
21
-
22
-
23
-
24
-
25
-
26
-
27
-
28
-
29
-
30
-
31
-
32
-
33
-
34
-
35
-
36
-
37
-
38
-
39
-
40
-
41
-
42
-
43
-
44
-
45
-
46
-
47
-
48
-
49
-
50
-
51
-
52
-
53
-
54
-
55
-
56
-
57
-
58
-
59
-
60
-
61
-
62
-
63
-
64
-
65
-
66
-
67
-
68
-
69
-
70
-
71
-
72
-
73
-
74
-
75
-
76
-
77
-
78
-
79
-
80
-
81
-
82
-
83
-
84
-
85
-
86
-
87
-
88
-
89
-
90
-
91
-
92
-
93
-
94
-
95
-
96
-
97
-
98
-
99
-
100
-
101
-
102
-
103
-
104
-
105
-
106
-
107
-
108
-
109
-
110
-
111
-
112
-
113
-
114
-
115
-
116
-
117
-
118
-
119
-
120
-
121
-
122
-
123
-
124
-
125
-
126
-
127
-
128
-
129
-
130
-
131
-
132
-
133
-
134
-
135
-
136
-
137
-
138
-
139
-
140
-
141
-
142
-
143
-
144
-
145
-
146
-
147
-
148
-
149
-
150
-
151
-
152
-
153
-
154
-
155
-
156
-
157
-
158
-
159
-
160
-
161
-
162
-
163
-
164
-
165
-
166
-
167
-
168
-
169
-
170
-
171
-
172
-
173
-
174
-
175
-
176
-
177
-
178
-
179
-
180
-
181
-
 182
182 -
 183
183 -
 184
184 -
 185
185 -
 186
186 -
 187
187 -
 188
188 -
 189
189 -
 190
190 -
 191
191 -
 192
192 -
 193
193 -
 194
194 -
 195
195 -
 196
196 -
 197
197 -
 198
198 -
 199
199 -
 200
200 -
 201
201 -
 202
202 -
203
-
204
-
205
-
206
-
207
-
208
-
209
-
210
-
211
-
212
-
213
-
214
-
215
-
216
-
217
-
218
-
219
-
220
-
221
-
222
-
223
-
224
-
225
-
226
-
227
-
228
-
229
-
230
-
231
-
232
-
233
-
234
-
235
-
236
-
237
-
238
-
239
-
240
-
241
-
242
-
243
-
244
-
245
-
246
-
247
-
248
-
249
-
250
-
251
-
252
-
253
-
254
-
255
-
256
-
257
-
258
-
259
-
260
-
261
-
262
-
263
-
264
-
265
-
266
-
267
-
268
-
269
-
270
-
271
-
272
-
273
-
274
-
275
-
276
 |
 |

THE HARTFORD FINANCIAL SERVICES GROUP, INC.
NOTES TO CONSOLIDATED FINANCIAL STATEMENTS (continued)
F-15
1. Basis of Presentation and Accounting Policies (continued)
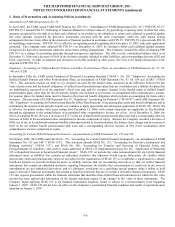
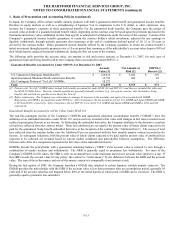
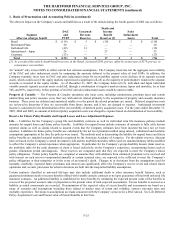
The following table provides the notional amount and SFAS 133 fair value at December 31, 2007, for each type of derivative asset held
by the Company to hedge capital markets risk for guaranteed living benefit sold by the Company:
Notional Amount
Fair Value
of the Assets[1]
Reinsurance $ 6,579 $ 128
Customized derivatives 12,784 50
Other derivative instruments 8,573 592
Total $ 27,936 $ 770
[1] The fair value of assets exceeds the SFAS 133 fair value of the liabilities in the table above. This is not an indication of hedge effectiveness and
does not suggest that the Company is over-hedged. Hedge results and the effectiveness of our hedging program is better measured as the
difference between the change in fair value of the assets and liabilities, both of which are highly dependent upon capital market movements.
Adoption of SFAS 157
Fair values for GMWB and GMAB contracts and the related reinsurance and customized derivatives that hedge certain equity markets
exposure for GMWB contracts are calculated based upon internally developed models because active, observable markets do not exist
for those items. Below is a description of the Company’ s fair value methodologies for guaranteed benefit liabilities, the related
reinsurance and customized derivatives, all accounted for under SFAS 133, prior to the adoption of SFAS 157 and subsequent to
adoption of SFAS 157.
Pre-SFAS 157 Fair Value
Prior to January 1, 2008, the Company used the guidance prescribed in SFAS 133 and other related accounting literature on fair value
which represented the amount for which a financial instrument could be exchanged in a current transaction between knowledgeable,
unrelated willing parties. However, under that accounting literature, when an estimate of fair value is made for liabilities where no
market observable transactions exist for that liability or similar liabilities, market risk margins are only included in the valuation if the
margin is identifiable, measurable and significant. If a reliable estimate of market risk margins is not obtainable, the present value of
expected future cash flows, discounted at the risk free rate of interest, may be the best available estimate of fair value in the
circumstances (“Pre-SFAS 157 Fair Value”).
The Pre-SFAS 157 Fair Value is calculated based on actuarial and capital market assumptions related to projected cash flows, including
benefits and related contract charges, over the lives of the contracts, incorporating expectations concerning policyholder behavior such
as lapses, fund selection, resets and withdrawal utilization (for the customized derivatives, policyholder behavior is prescribed in the
derivative contract). Because of the dynamic and complex nature of these cash flows, best estimate assumptions and a Monte Carlo
stochastic process involving the generation of thousands of scenarios that assume risk neutral returns consistent with swap rates and a
blend of observable implied index volatility levels are used. Estimating these cash flows involves numerous estimates and subjective
judgments including those regarding expected markets rates of return, market volatility, correlations of market index returns to funds,
fund performance, discount rates and policyholder behavior. At each valuation date, the Company assumes expected returns based on
risk-free rates as represented by the current LIBOR forward curve rates; forward market volatility assumptions for each underlying
index based primarily on a blend of observed market “implied volatility” data; correlations of market returns across underlying indices
based on actual observed market returns and relationships over the ten years preceding the valuation date; three years of history for
fund regression; and current risk-free spot rates as represented by the current LIBOR spot curve to determine the present value of
expected future cash flows produced in the stochastic projection process. As GMWB obligations are relatively new in the marketplace,
actual policyholder behavior experience is limited. As a result, estimates of future policyholder behavior are subjective and based on
analogous internal and external data. As markets change, mature and evolve and actual policyholder behavior emerges, management
continually evaluates the appropriateness of its assumptions for this component of the fair value model.