The Hartford 2007 Annual Report Download - page 146
Download and view the complete annual report
Please find page 146 of the 2007 The Hartford annual report below. You can navigate through the pages in the report by either clicking on the pages listed below, or by using the keyword search tool below to find specific information within the annual report.-
 1
1 -
2
-
3
-
4
-
5
-
6
-
7
-
8
-
9
-
10
-
11
-
12
-
13
-
14
-
15
-
16
-
17
-
18
-
19
-
20
-
21
-
22
-
23
-
24
-
25
-
26
-
27
-
28
-
29
-
30
-
31
-
32
-
33
-
34
-
35
-
36
-
37
-
38
-
39
-
40
-
41
-
42
-
43
-
44
-
45
-
46
-
47
-
48
-
49
-
50
-
51
-
52
-
53
-
54
-
55
-
56
-
57
-
58
-
59
-
60
-
61
-
62
-
63
-
64
-
65
-
66
-
67
-
68
-
69
-
70
-
71
-
72
-
73
-
74
-
75
-
76
-
77
-
78
-
79
-
80
-
81
-
82
-
83
-
84
-
85
-
86
-
87
-
88
-
89
-
90
-
91
-
92
-
93
-
94
-
95
-
96
-
97
-
98
-
99
-
100
-
101
-
102
-
103
-
104
-
105
-
106
-
107
-
108
-
109
-
110
-
111
-
112
-
113
-
114
-
115
-
116
-
117
-
118
-
119
-
120
-
121
-
122
-
123
-
124
-
125
-
126
-
127
-
128
-
129
-
130
-
131
-
132
-
133
-
134
-
135
-
 136
136 -
 137
137 -
 138
138 -
 139
139 -
 140
140 -
 141
141 -
 142
142 -
 143
143 -
 144
144 -
 145
145 -
 146
146 -
 147
147 -
 148
148 -
 149
149 -
 150
150 -
 151
151 -
 152
152 -
 153
153 -
 154
154 -
 155
155 -
 156
156 -
157
-
158
-
159
-
160
-
161
-
162
-
163
-
164
-
165
-
166
-
167
-
168
-
169
-
170
-
171
-
172
-
173
-
174
-
175
-
176
-
177
-
178
-
179
-
180
-
181
-
182
-
183
-
184
-
185
-
186
-
187
-
188
-
189
-
190
-
191
-
192
-
193
-
194
-
195
-
196
-
197
-
198
-
199
-
200
-
201
-
202
-
203
-
204
-
205
-
206
-
207
-
208
-
209
-
210
-
211
-
212
-
213
-
214
-
215
-
216
-
217
-
218
-
219
-
220
-
221
-
222
-
223
-
224
-
225
-
226
-
227
-
228
-
229
-
230
-
231
-
232
-
233
-
234
-
235
-
236
-
237
-
238
-
239
-
240
-
241
-
242
-
243
-
244
-
245
-
246
-
247
-
248
-
249
-
250
-
251
-
252
-
253
-
254
-
255
-
256
-
257
-
258
-
259
-
260
-
261
-
262
-
263
-
264
-
265
-
266
-
267
-
268
-
269
-
270
-
271
-
272
-
273
-
274
-
275
-
276
 |
 |

146
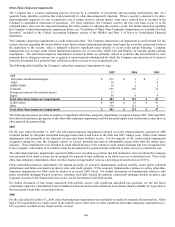
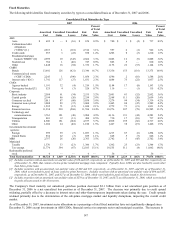
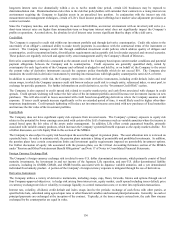
The following table presents the notional, fair value, derivative credit risk, and underlying referenced asset average credit ratings for
credit derivatives in which the Company is assuming credit risk as of December 31, 2007.
December 31, 2007
Underlying Referenced Asset(s)
Notional
Amount Fair Value
Average Credit
Risk Exposure Type
Average
Credit Rating
Credit default swaps [1]
Investment grade risk exposure $ 2,263 $(135) AA Corporate Credit BBB+
Below investment grade risk exposure [2] 594 (281) CCC+ Corporate Credit BBB-
Credit index swaps 1,456 (29) AAA Lehman CMBS Index AAA
Total return swaps 850 (41) NR to A Bank Loans B
Total $ 5,163 $(486)
[1] Includes $2.0 billion, as of December 31, 2007, of a standard market index of diversified portfolios of corporate issuers referenced through credit
default swaps. These swaps are subsequently valued based upon the observable standard market index.
[2] The fair value includes cash payments received at the inception of certain contracts of $201. The net loss for the year ended December 31, 2007,
was $92, before-tax.
Credit default swaps involve a transfer of credit risk of one or many referenced entities from one party to another in exchange for
periodic payments. The party that purchases credit protection will make a payment based on an agreed upon rate and notional amount.
The second party, who assumes credit exposure, will typically only make a payment if there is a credit event and such payment will be
equal to the notional value of the swap contract less the value of the referenced security issuer’ s debt obligation. A credit event is
generally defined as default on contractually obligated interest or principal payments or bankruptcy of the referenced entity. These
swaps replicate the credit spread component of fixed maturities and are an efficient means to manage credit exposure without directly
investing in the cash market investments.
The credit default swaps in which the Company assumes credit risk reference investment grade single corporate issuers, baskets of up to
five corporate issuers and diversified portfolios of corporate issuers. The diversified portfolios of corporate issuers are established
within sector concentration limits and are typically divided into tranches which possess different credit ratings ranging from AAA
through the CCC rated first loss position.
The credit index swaps assume the credit risk of a referenced AAA rated tranche of a commercial mortgage security index. The credit
index swap contracts pay or receive amounts based upon changes in the referenced index and are typically six months in duration. In
February 2008, the credit index swaps were closed and resulted in an additional $109, before-tax, net realized capital loss which will be
recorded in the first quarter 2008.
The Company’ s total return swaps assume the credit risk of a referenced portfolio of bank loans. Total return swaps involve the periodic
exchange of payments with other parties, at specified intervals, calculated using the agreed upon index and notional principal amounts.
The party assuming the credit risk receives periodic coupon payments plus changes in value of a referenced asset, portfolio or index
while paying the other counterparty a fixed or floating cash flow unrelated to the referenced credit(s) or index. Typically, the net
payments exchanged associated with total return swaps have similar economic characteristics to fixed maturities.