The Hartford 2007 Annual Report Download - page 18
Download and view the complete annual report
Please find page 18 of the 2007 The Hartford annual report below. You can navigate through the pages in the report by either clicking on the pages listed below, or by using the keyword search tool below to find specific information within the annual report.-
 1
1 -
2
-
3
-
4
-
5
-
6
-
7
-
 8
8 -
 9
9 -
 10
10 -
 11
11 -
 12
12 -
 13
13 -
 14
14 -
 15
15 -
 16
16 -
 17
17 -
 18
18 -
 19
19 -
 20
20 -
 21
21 -
 22
22 -
 23
23 -
 24
24 -
 25
25 -
 26
26 -
 27
27 -
 28
28 -
29
-
30
-
31
-
32
-
33
-
34
-
35
-
36
-
37
-
38
-
39
-
40
-
41
-
42
-
43
-
44
-
45
-
46
-
47
-
48
-
49
-
50
-
51
-
52
-
53
-
54
-
55
-
56
-
57
-
58
-
59
-
60
-
61
-
62
-
63
-
64
-
65
-
66
-
67
-
68
-
69
-
70
-
71
-
72
-
73
-
74
-
75
-
76
-
77
-
78
-
79
-
80
-
81
-
82
-
83
-
84
-
85
-
86
-
87
-
88
-
89
-
90
-
91
-
92
-
93
-
94
-
95
-
96
-
97
-
98
-
99
-
100
-
101
-
102
-
103
-
104
-
105
-
106
-
107
-
108
-
109
-
110
-
111
-
112
-
113
-
114
-
115
-
116
-
117
-
118
-
119
-
120
-
121
-
122
-
123
-
124
-
125
-
126
-
127
-
128
-
129
-
130
-
131
-
132
-
133
-
134
-
135
-
136
-
137
-
138
-
139
-
140
-
141
-
142
-
143
-
144
-
145
-
146
-
147
-
148
-
149
-
150
-
151
-
152
-
153
-
154
-
155
-
156
-
157
-
158
-
159
-
160
-
161
-
162
-
163
-
164
-
165
-
166
-
167
-
168
-
169
-
170
-
171
-
172
-
173
-
174
-
175
-
176
-
177
-
178
-
179
-
180
-
181
-
182
-
183
-
184
-
185
-
186
-
187
-
188
-
189
-
190
-
191
-
192
-
193
-
194
-
195
-
196
-
197
-
198
-
199
-
200
-
201
-
202
-
203
-
204
-
205
-
206
-
207
-
208
-
209
-
210
-
211
-
212
-
213
-
214
-
215
-
216
-
217
-
218
-
219
-
220
-
221
-
222
-
223
-
224
-
225
-
226
-
227
-
228
-
229
-
230
-
231
-
232
-
233
-
234
-
235
-
236
-
237
-
238
-
239
-
240
-
241
-
242
-
243
-
244
-
245
-
246
-
247
-
248
-
249
-
250
-
251
-
252
-
253
-
254
-
255
-
256
-
257
-
258
-
259
-
260
-
261
-
262
-
263
-
264
-
265
-
266
-
267
-
268
-
269
-
270
-
271
-
272
-
273
-
274
-
275
-
276
 |
 |

18
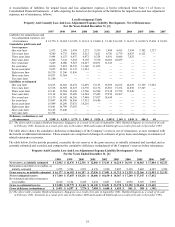
A reconciliation of liabilities for unpaid losses and loss adjustment expenses is herein referenced from Note 11 of Notes to
Consolidated Financial Statements. A table depicting the historical development of the liabilities for unpaid losses and loss adjustment
expenses, net of reinsurance, follows.
Loss Development Table
Property And Casualty Loss And Loss Adjustment Expense Liability Development - Net of Reinsurance
For the Years Ended December 31, [1]
1997 1998 1999 2000 2001 2002 2003 2004 2005 2006 2007
Liabilities for unpaid losses and
loss adjustment expenses, net
of reinsurance
$
12,770
$
12,902
$ 12,476
$12,316
$12,860
$13,141
$
16,218
$
16,191
$ 16,863
$17,604
$
18,231
Cumulative paid losses and
loss expenses
One year later 2,472 2,939 2,994 3,272 3,339 3,480 4,415 3,594 3,702 3,727
Two years later 4,300 4,733 5,019 5,315 5,621 6,781 6,779 6,035 6,122 —
Three years later 5,494 6,153 6,437 6,972 8,324 8,591 8,686 7,825 — —
Four years later 6,508 7,141 7,652 9,195 9,710 10,061 10,075 — — —
Five years later 7,249 8,080 9,567 10,227 10,871 11,181 — — — —
Six years later 8,036 9,818 10,376 11,140 11,832 — — — — —
Seven years later 9,655 10,501 11,137 11,961 — — — — — —
Eight years later 10,239 11,246 11,856 — — — — — — —
Nine years later 10,933 11,964 — — — — — — — —
Ten years later 11,586 — — — — — — — — —
Liabilities re-estimated
One year later 12,615 12,662 12,472 12,459 13,153 15,965 16,632 16,439 17,159 17,652
Two years later 12,318 12,569 12,527 12,776 16,176 16,501 17,232 16,838 17,347 —
Three years later 12,183 12,584 12,698 15,760 16,768 17,338 17,739 17,240 — —
Four years later 12,138 12,663 15,609 16,584 17,425 17,876 18,367 — — —
Five years later 12,179 15,542 16,256 17,048 17,927 18,630 — — — —
Six years later 15,047 16,076 16,568 17,512 18,686 — — — — —
Seven years later 15,499 16,290 17,031 18,216 — — — — — —
Eight years later 15,641 16,799 17,655 — — — — — — —
Nine years later 16,165 17,440 — — — — — — — —
Ten years later 16,768 — — — — — — — — —
Deficiency (redundancy), net
of reinsurance
$
3,998
$
4,538
$ 5,179
$5,900
$5,826
$5,489
$
2,149
$
1,049
$ 484 $ 48
[1] The above table excludes Hartford Insurance, Singapore as a result of its sale in September 2001, Hartford Seguros as a result of its sale
in February 2001, Zwolsche as a result of its sale in December 2000 and London & Edinburgh as a result of its sale in November 1998.
The table above shows the cumulative deficiency (redundancy) of the Company’ s reserves, net of reinsurance, as now estimated with
the benefit of additional information. Those amounts are comprised of changes in estimates of gross losses and changes in estimates of
related reinsurance recoveries.
The table below, for the periods presented, reconciles the net reserves to the gross reserves, as initially estimated and recorded, and as
currently estimated and recorded, and computes the cumulative deficiency (redundancy) of the Company’ s reserves before reinsurance.
Property And Casualty Loss And Loss Adjustment Expense Liability Development - Gross
For the Years Ended December 31, [1]
1998 1999 2000 2001 2002 2003 2004 2005 2006 2007
Net reserve, as initially estimated $ 12,902 $ 12,476 $12,316 $12,860 $13,141 $16,218 $ 16,191 $ 16,863 $17,604 $18,231
Reinsurance and other recoverables, as
initially estimated
3,275
3,706
3,871 4,176 3,950 5,497
5,138
5,403 4,387
3,922
Gross reserve, as initially estimated $ 16,177 $ 16,182 $16,187 $17,036 $17,091 $21,715 $ 21,329 $ 22,266 $21,991 $22,153
Net re-estimated reserve $ 17,440 $ 17,655 $18,216 $18,686 $18,630 $18,367 $ 17,240 $ 17,347 $17,652
Re-estimated and other reinsurance
recoverables
4,140
5,124
5,245
5,434
5,061
5,003
4,950
5,307
3,958
Gross re-estimated reserve $ 21,580 $ 22,779 $23,461 $24,120 $23,691 $23,370 $ 22,190 $ 22,654 $21,610
Gross deficiency (redundancy) $ 5,403 $ 6,597 $7,274 $7,084 $6,600 $1,655 $ 861 $ 388 $ (381)
[1] The above table excludes Hartford Insurance, Singapore as a result of its sale in September 2001, Hartford Seguros as a result of its sale
in February 2001, Zwolsche as a result of its sale in December 2000 and London & Edinburgh as a result of its sale in November 1998.