The Hartford 2007 Annual Report Download - page 141
Download and view the complete annual report
Please find page 141 of the 2007 The Hartford annual report below. You can navigate through the pages in the report by either clicking on the pages listed below, or by using the keyword search tool below to find specific information within the annual report.-
 1
1 -
2
-
3
-
4
-
5
-
6
-
7
-
8
-
9
-
10
-
11
-
12
-
13
-
14
-
15
-
16
-
17
-
18
-
19
-
20
-
21
-
22
-
23
-
24
-
25
-
26
-
27
-
28
-
29
-
30
-
31
-
32
-
33
-
34
-
35
-
36
-
37
-
38
-
39
-
40
-
41
-
42
-
43
-
44
-
45
-
46
-
47
-
48
-
49
-
50
-
51
-
52
-
53
-
54
-
55
-
56
-
57
-
58
-
59
-
60
-
61
-
62
-
63
-
64
-
65
-
66
-
67
-
68
-
69
-
70
-
71
-
72
-
73
-
74
-
75
-
76
-
77
-
78
-
79
-
80
-
81
-
82
-
83
-
84
-
85
-
86
-
87
-
88
-
89
-
90
-
91
-
92
-
93
-
94
-
95
-
96
-
97
-
98
-
99
-
100
-
101
-
102
-
103
-
104
-
105
-
106
-
107
-
108
-
109
-
110
-
111
-
112
-
113
-
114
-
115
-
116
-
117
-
118
-
119
-
120
-
121
-
122
-
123
-
124
-
125
-
126
-
127
-
128
-
129
-
130
-
 131
131 -
 132
132 -
 133
133 -
 134
134 -
 135
135 -
 136
136 -
 137
137 -
 138
138 -
 139
139 -
 140
140 -
 141
141 -
 142
142 -
 143
143 -
 144
144 -
 145
145 -
 146
146 -
 147
147 -
 148
148 -
 149
149 -
 150
150 -
 151
151 -
152
-
153
-
154
-
155
-
156
-
157
-
158
-
159
-
160
-
161
-
162
-
163
-
164
-
165
-
166
-
167
-
168
-
169
-
170
-
171
-
172
-
173
-
174
-
175
-
176
-
177
-
178
-
179
-
180
-
181
-
182
-
183
-
184
-
185
-
186
-
187
-
188
-
189
-
190
-
191
-
192
-
193
-
194
-
195
-
196
-
197
-
198
-
199
-
200
-
201
-
202
-
203
-
204
-
205
-
206
-
207
-
208
-
209
-
210
-
211
-
212
-
213
-
214
-
215
-
216
-
217
-
218
-
219
-
220
-
221
-
222
-
223
-
224
-
225
-
226
-
227
-
228
-
229
-
230
-
231
-
232
-
233
-
234
-
235
-
236
-
237
-
238
-
239
-
240
-
241
-
242
-
243
-
244
-
245
-
246
-
247
-
248
-
249
-
250
-
251
-
252
-
253
-
254
-
255
-
256
-
257
-
258
-
259
-
260
-
261
-
262
-
263
-
264
-
265
-
266
-
267
-
268
-
269
-
270
-
271
-
272
-
273
-
274
-
275
-
276
 |
 |

141
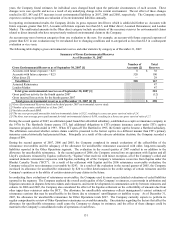
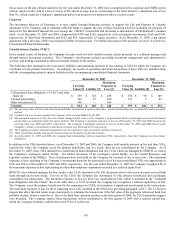
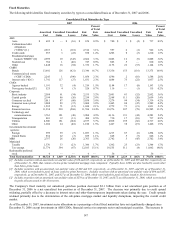
The following table summarizes Property & Casualty’s limited partnerships and other alternative investments as of December 31, 2007
and 2006.
Composition of Limited Partnerships and Other Alternative Investments
2007 2006
Amount Percent
Amount Percent
Hedge funds [1] $ 728 57.8% $ 508 63.3%
Private equity [2] 193 15.3% 123 15.3%
Mortgage and real estate [3] 291 23.1% 124 15.5%
Mezzanine debt [4] 48 3.8% 47 5.9%
Total $ 1,260 100.0% $ 802 100.0%
[1] Hedge funds include investments in funds of funds as well as direct funds. The hedge funds of funds invest in approximately 30 to 60 different
hedge funds within a variety of investment styles. Examples of hedge fund strategies include long/short equity or credit, event driven strategies
and structured credit.
[2] Private equity funds consist of investments in funds whose assets typically consist of a diversified pool of investments in small non-public
businesses with high growth potential.
[3] Mortgage and real estate funds consist of investments in funds whose assets consist of mortgage loans, participations in mortgage loans,
mezzanine loans or other notes which may be below investment grade credit quality as well as equity real estate. Also included is the investment
in real estate joint venture.
[4] Mezzanine debt funds consist of investments in funds whose assets consist of subordinated debt that often times incorporates equity-based options
such as warrants and a limited amount of direct equity investments.
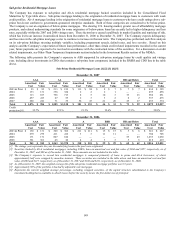
Investment Results
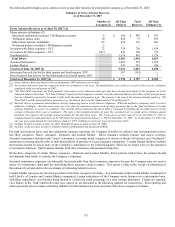
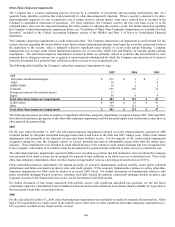
The following table below summarizes Property & Casualty’ s net investment income.
2007 2006 2005
(Before-tax) Amount Yield [1] Amount Yield [1] Amount Yield [1]
Fixed maturities [2] $1,511 5.7% $ 1,386 5.5% $ 1,280 5.5%
Equity securities, available-for-sale 50 6.0% 35 5.5% 18 4.0%
Mortgage loans 38 6.2% 16 5.6% 11 5.6%
Limited partnerships and other alternative investments 140 14.5% 64 9.9% 63 13.0%
Other [3] (27) — 9 — 10 —
Investment expense (25) — (24) — (17) —
Net investment income, before-tax $1,687 5.9% $ 1,486 5.5% $ 1,365 5.5%
Net investment income, after-tax [4] $1,246 4.4% $ 1,107 4.1% $ 1,016 4.1%
[1] Yields calculated using investment income before investment expenses divided by the monthly weighted average invested assets at cost, amortized
cost, or adjusted carrying value, as applicable, and collateral received associated with the securities lending program. Included in the fixed
maturity yield is Other income (loss) as it primarily relates to fixed maturities, see footnote [3] below. Included in the total net investment income
yield is investment expense.
[2] Includes net investment income on short-term bonds.
[3] Primarily represents fees associated with securities lending activities. The income from securities lending activities is included within fixed
maturities. Also included are derivatives that qualify for hedge accounting under SFAS 133. These derivatives hedge fixed maturities.
[4] Due to significant holdings in tax-exempt investments, after-tax net investment income and yield are also included.