The Hartford 2007 Annual Report Download - page 143
Download and view the complete annual report
Please find page 143 of the 2007 The Hartford annual report below. You can navigate through the pages in the report by either clicking on the pages listed below, or by using the keyword search tool below to find specific information within the annual report.-
 1
1 -
2
-
3
-
4
-
5
-
6
-
7
-
8
-
9
-
10
-
11
-
12
-
13
-
14
-
15
-
16
-
17
-
18
-
19
-
20
-
21
-
22
-
23
-
24
-
25
-
26
-
27
-
28
-
29
-
30
-
31
-
32
-
33
-
34
-
35
-
36
-
37
-
38
-
39
-
40
-
41
-
42
-
43
-
44
-
45
-
46
-
47
-
48
-
49
-
50
-
51
-
52
-
53
-
54
-
55
-
56
-
57
-
58
-
59
-
60
-
61
-
62
-
63
-
64
-
65
-
66
-
67
-
68
-
69
-
70
-
71
-
72
-
73
-
74
-
75
-
76
-
77
-
78
-
79
-
80
-
81
-
82
-
83
-
84
-
85
-
86
-
87
-
88
-
89
-
90
-
91
-
92
-
93
-
94
-
95
-
96
-
97
-
98
-
99
-
100
-
101
-
102
-
103
-
104
-
105
-
106
-
107
-
108
-
109
-
110
-
111
-
112
-
113
-
114
-
115
-
116
-
117
-
118
-
119
-
120
-
121
-
122
-
123
-
124
-
125
-
126
-
127
-
128
-
129
-
130
-
131
-
132
-
 133
133 -
 134
134 -
 135
135 -
 136
136 -
 137
137 -
 138
138 -
 139
139 -
 140
140 -
 141
141 -
 142
142 -
 143
143 -
 144
144 -
 145
145 -
 146
146 -
 147
147 -
 148
148 -
 149
149 -
 150
150 -
 151
151 -
 152
152 -
 153
153 -
154
-
155
-
156
-
157
-
158
-
159
-
160
-
161
-
162
-
163
-
164
-
165
-
166
-
167
-
168
-
169
-
170
-
171
-
172
-
173
-
174
-
175
-
176
-
177
-
178
-
179
-
180
-
181
-
182
-
183
-
184
-
185
-
186
-
187
-
188
-
189
-
190
-
191
-
192
-
193
-
194
-
195
-
196
-
197
-
198
-
199
-
200
-
201
-
202
-
203
-
204
-
205
-
206
-
207
-
208
-
209
-
210
-
211
-
212
-
213
-
214
-
215
-
216
-
217
-
218
-
219
-
220
-
221
-
222
-
223
-
224
-
225
-
226
-
227
-
228
-
229
-
230
-
231
-
232
-
233
-
234
-
235
-
236
-
237
-
238
-
239
-
240
-
241
-
242
-
243
-
244
-
245
-
246
-
247
-
248
-
249
-
250
-
251
-
252
-
253
-
254
-
255
-
256
-
257
-
258
-
259
-
260
-
261
-
262
-
263
-
264
-
265
-
266
-
267
-
268
-
269
-
270
-
271
-
272
-
273
-
274
-
275
-
276
 |
 |

143
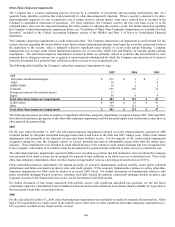
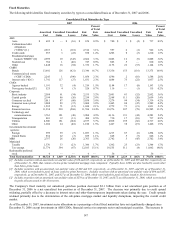
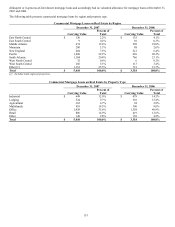
Gross losses on the sale of fixed maturities for the year ended December 31, 2006 were concentrated in the corporate and CMBS sectors
with no single security sold at a loss in excess of $4, and an average loss as a percentage of the fixed maturity’ s amortized cost of less
than 3%, which, under the Company’ s impairment policy was deemed to be depressed only to a minor extent.
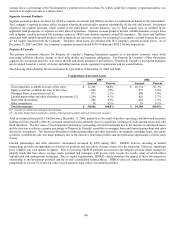
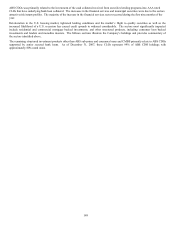
Corporate
The investment objective of Corporate is to raise capital through financing activities to support the Life and Property & Casualty
operations of the Company and to maintain sufficient funds to support the cost of those financing activities including the payment of
interest for The Hartford Financial Services Group, Inc. (“HFSG”) issued debt and dividends to shareholders of The Hartford’s common
stock. As of December 31, 2007 and 2006, Corporate held $308 and $259, respectively, of fixed maturity investments, $160 and $145,
respectively, of short-term investments and $103 and $55, respectively, of equity securities. As of December 31, 2007, a put option
agreement with a fair value of $43 was included in Other invested assets. For further discussion of this position, see Note 14 of Notes to
Consolidated Financial Statements.
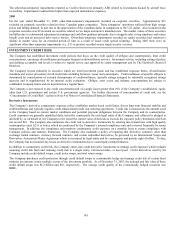
Variable Interest Entities (“VIE”)
In the normal course of business, the Company becomes involved with variable interest entities primarily as a collateral manager and
through normal investment activities. The Company’ s involvement includes providing investment management and administrative
services, and holding ownership or other investment interests in the entities.
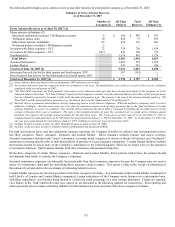
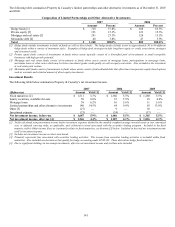
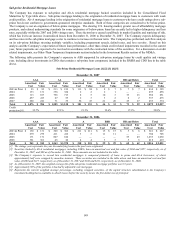
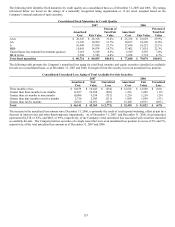
The following table summarizes the total assets, liabilities and maximum exposure to loss relating to VIEs for which the Company has
concluded it is the primary beneficiary. Accordingly, the results of operations and financial position of these VIEs are included along
with the corresponding minority interest liabilities in the accompanying consolidated financial statements.
December 31, 2007 December 31, 2006
Carrying
Value [1] Liability [2]
Maximum
Exposure to
Loss [3]
Carr
y
in
g
Value [1] Liability [2]
Maximum
Exposure to
Loss [3]
Collateralized loan obligations (“CLOs”) and other
funds [4] $ 359 $ 118 $ 258 $ 296 $ 99 $ 189
Limited partnerships 309 47 220 103 5 85
Other investments [5] 146 — 166 — — —
Total [6] $ 814 $ 165 $ 644 $ 399 $ 104 $ 274
[1] The carrying value of CLOs and other funds and Other investments is equal to fair value. Limited partnerships are accounted for under the equity
method.
[2] Creditors have no recourse against the Company in the event of default by the VIE.
[3] The maximum exposure to loss does not include changes in fair value or the Company’s proportionate shares of earnings associated with limited
partnerships accounted for under the equity method. The Company’s maximum exposure to loss as of December 31, 2007 and 2006 based on the
carrying value was $649 and $295, respectively. The Company’s maximum exposure to loss as of December 31, 2007 and 2006 based on the
Company’s initial co-investment or amortized cost basis was $644 and $274, respectively.
[4] The Company provides collateral management services and earns a fee associated with these structures.
[5] Other investments include investment structures that are backed by preferred securities.
[6] As of December 31, 2007 and 2006, the Company had relationships with seven and four VIEs, respectively, where the Company was the primary
beneficiary.
In addition to the VIEs described above, as of December 31, 2007 and 2006, the Company held variable interests in five and three VIEs,
respectively, where the Company is not the primary beneficiary and as a result, these are not consolidated by the Company. As of
December 31, 2007, these VIEs included two collateralized bond obligations and two CLOs which are managed by HIMCO, as well as
the Company’ s contingent capital facility. For further discussion of the contingent capital facility, see the Capital Resources and
Liquidity section of the MD&A. These investments have been held by the Company for a period of one to four years. The maximum
exposure to loss consisting of the Company’ s investments based on the amortized cost of the non-consolidated VIEs was approximately
$150 and $20 as of December 31, 2007 and 2006, respectively. For the year ended December 31, 2007 the Company recognized $5 of
the maximum exposure to loss representing an other-than-temporary impairment recorded as a realized capital loss.
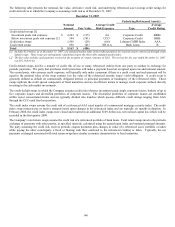
HIMCO is the collateral manager for four market value CLOs (included in the VIE discussion above) that invest in senior secured bank
loans through total return swaps. For two of the CLOs, the Company has determined it is the primary beneficiary and accordingly
consolidates the transactions. The maximum exposure to loss for these two consolidated CLOs, which is included in the “Collateral
loan obligations and other funds” line in the table above, is $107 of which the Company has recognized a realized capital loss of $26.
The Company is not the primary beneficiary for the remaining two CLOs, but maintains a significant involvement in the transactions.
The maximum exposure to loss for these remaining two CLOs, included in the $150 in the preceding paragraph, is $37. The CLOs have
triggers that allow the total return swap counterparty to terminate the transactions if the fair value of the aggregate referenced bank loan
portfolio declines below a stated level. Due to the bank loan valuation declines in the first quarter of 2008, the CLO termination triggers
were breached. The Company expects these transactions will be terminated in the first quarter of 2008 with a realized capital loss,
which the Company estimates could be between $75-$115, before-tax.