The Hartford 2007 Annual Report Download - page 212
Download and view the complete annual report
Please find page 212 of the 2007 The Hartford annual report below. You can navigate through the pages in the report by either clicking on the pages listed below, or by using the keyword search tool below to find specific information within the annual report.-
 1
1 -
2
-
3
-
4
-
5
-
6
-
7
-
8
-
9
-
10
-
11
-
12
-
13
-
14
-
15
-
16
-
17
-
18
-
19
-
20
-
21
-
22
-
23
-
24
-
25
-
26
-
27
-
28
-
29
-
30
-
31
-
32
-
33
-
34
-
35
-
36
-
37
-
38
-
39
-
40
-
41
-
42
-
43
-
44
-
45
-
46
-
47
-
48
-
49
-
50
-
51
-
52
-
53
-
54
-
55
-
56
-
57
-
58
-
59
-
60
-
61
-
62
-
63
-
64
-
65
-
66
-
67
-
68
-
69
-
70
-
71
-
72
-
73
-
74
-
75
-
76
-
77
-
78
-
79
-
80
-
81
-
82
-
83
-
84
-
85
-
86
-
87
-
88
-
89
-
90
-
91
-
92
-
93
-
94
-
95
-
96
-
97
-
98
-
99
-
100
-
101
-
102
-
103
-
104
-
105
-
106
-
107
-
108
-
109
-
110
-
111
-
112
-
113
-
114
-
115
-
116
-
117
-
118
-
119
-
120
-
121
-
122
-
123
-
124
-
125
-
126
-
127
-
128
-
129
-
130
-
131
-
132
-
133
-
134
-
135
-
136
-
137
-
138
-
139
-
140
-
141
-
142
-
143
-
144
-
145
-
146
-
147
-
148
-
149
-
150
-
151
-
152
-
153
-
154
-
155
-
156
-
157
-
158
-
159
-
160
-
161
-
162
-
163
-
164
-
165
-
166
-
167
-
168
-
169
-
170
-
171
-
172
-
173
-
174
-
175
-
176
-
177
-
178
-
179
-
180
-
181
-
182
-
183
-
184
-
185
-
186
-
187
-
188
-
189
-
190
-
191
-
192
-
193
-
194
-
195
-
196
-
197
-
198
-
199
-
200
-
201
-
 202
202 -
 203
203 -
 204
204 -
 205
205 -
 206
206 -
 207
207 -
 208
208 -
 209
209 -
 210
210 -
 211
211 -
 212
212 -
 213
213 -
 214
214 -
 215
215 -
 216
216 -
 217
217 -
 218
218 -
 219
219 -
 220
220 -
 221
221 -
 222
222 -
223
-
224
-
225
-
226
-
227
-
228
-
229
-
230
-
231
-
232
-
233
-
234
-
235
-
236
-
237
-
238
-
239
-
240
-
241
-
242
-
243
-
244
-
245
-
246
-
247
-
248
-
249
-
250
-
251
-
252
-
253
-
254
-
255
-
256
-
257
-
258
-
259
-
260
-
261
-
262
-
263
-
264
-
265
-
266
-
267
-
268
-
269
-
270
-
271
-
272
-
273
-
274
-
275
-
276
 |
 |

THE HARTFORD FINANCIAL SERVICES GROUP, INC.
NOTES TO CONSOLIDATED FINANCIAL STATEMENTS (continued)
F-35
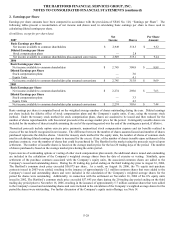
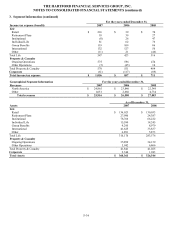
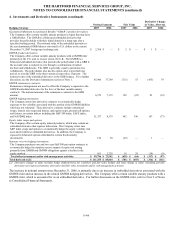
4. Investments and Derivative Instruments
For the years ended December 31,
Components of Net Investment Income 2007 2006 2005
Fixed maturities [1] $4,653 $ 4,266 $3,952
Equity securities held for trading 145 1,824 3,847
Policy loans 135 142 144
Mortgage loans on real estate 293 158 84
Other investments 233 212 267
Gross investment income 5,459 6,602 8,294
Less: Investment expenses 100 87 63
Net investment income $5,359 $ 6,515 $8,231
Components of Net Realized Capital Gains (Losses)
Fixed maturities $(357) $ (113) $95
Equity securities (43) (11) 3
Foreign currency transaction remeasurements (109) 17 162
Derivatives and other [2] (485) (144) (243)
Net realized capital gains (losses) $(994) $ (251) $17
[1] Includes income on short-term bonds.
[2] Primarily consists of changes in fair value on non-qualifying derivatives, changes in fair value of certain derivatives in fair value hedge
relationships and hedge ineffectiveness on qualifying derivative instruments.
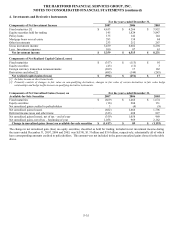
Components of Net Unrealized Gains (Losses) on For the years ended December 31,
Available-for-Sale Securities 2007 2006 2005
Fixed maturities $(669) $ 1,466 $1,674
Equity securities (16) 204 131
Net unrealized gains credited to policyholders 3 (4) (9)
Net unrealized gains (losses) (682) 1,666 1,796
Deferred income taxes and other items (323) 608 827
Net unrealized gains (losses), net of tax – end of year (359) 1,058 969
Net unrealized gains, net of tax – beginning of year 1,058 969 2,162
Change in unrealized gains (losses) on available-for-sale securities $(1,417) $ 89 $(1,193)
The change in net unrealized gain (loss) on equity securities, classified as held for trading, included in net investment income during
the years ended December 31, 2007, 2006 and 2005, was $(539), $1.3 billion and $3.6 billion, respectively, substantially all of which
have corresponding amounts credited to policyholders. This amount was not included in the gross unrealized gains (losses) in the table
above.