The Hartford 2007 Annual Report Download - page 131
Download and view the complete annual report
Please find page 131 of the 2007 The Hartford annual report below. You can navigate through the pages in the report by either clicking on the pages listed below, or by using the keyword search tool below to find specific information within the annual report.-
 1
1 -
2
-
3
-
4
-
5
-
6
-
7
-
8
-
9
-
10
-
11
-
12
-
13
-
14
-
15
-
16
-
17
-
18
-
19
-
20
-
21
-
22
-
23
-
24
-
25
-
26
-
27
-
28
-
29
-
30
-
31
-
32
-
33
-
34
-
35
-
36
-
37
-
38
-
39
-
40
-
41
-
42
-
43
-
44
-
45
-
46
-
47
-
48
-
49
-
50
-
51
-
52
-
53
-
54
-
55
-
56
-
57
-
58
-
59
-
60
-
61
-
62
-
63
-
64
-
65
-
66
-
67
-
68
-
69
-
70
-
71
-
72
-
73
-
74
-
75
-
76
-
77
-
78
-
79
-
80
-
81
-
82
-
83
-
84
-
85
-
86
-
87
-
88
-
89
-
90
-
91
-
92
-
93
-
94
-
95
-
96
-
97
-
98
-
99
-
100
-
101
-
102
-
103
-
104
-
105
-
106
-
107
-
108
-
109
-
110
-
111
-
112
-
113
-
114
-
115
-
116
-
117
-
118
-
119
-
120
-
 121
121 -
 122
122 -
 123
123 -
 124
124 -
 125
125 -
 126
126 -
 127
127 -
 128
128 -
 129
129 -
 130
130 -
 131
131 -
 132
132 -
 133
133 -
 134
134 -
 135
135 -
 136
136 -
 137
137 -
 138
138 -
 139
139 -
 140
140 -
 141
141 -
142
-
143
-
144
-
145
-
146
-
147
-
148
-
149
-
150
-
151
-
152
-
153
-
154
-
155
-
156
-
157
-
158
-
159
-
160
-
161
-
162
-
163
-
164
-
165
-
166
-
167
-
168
-
169
-
170
-
171
-
172
-
173
-
174
-
175
-
176
-
177
-
178
-
179
-
180
-
181
-
182
-
183
-
184
-
185
-
186
-
187
-
188
-
189
-
190
-
191
-
192
-
193
-
194
-
195
-
196
-
197
-
198
-
199
-
200
-
201
-
202
-
203
-
204
-
205
-
206
-
207
-
208
-
209
-
210
-
211
-
212
-
213
-
214
-
215
-
216
-
217
-
218
-
219
-
220
-
221
-
222
-
223
-
224
-
225
-
226
-
227
-
228
-
229
-
230
-
231
-
232
-
233
-
234
-
235
-
236
-
237
-
238
-
239
-
240
-
241
-
242
-
243
-
244
-
245
-
246
-
247
-
248
-
249
-
250
-
251
-
252
-
253
-
254
-
255
-
256
-
257
-
258
-
259
-
260
-
261
-
262
-
263
-
264
-
265
-
266
-
267
-
268
-
269
-
270
-
271
-
272
-
273
-
274
-
275
-
276
 |
 |

131
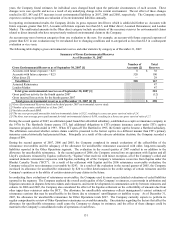
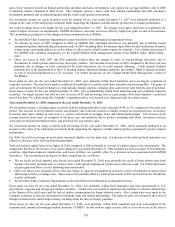
years, the Company found estimates for individual cases changed based upon the particular circumstances of each account. These
changes were case specific and not as a result of any underlying change in the current environment. The net effect of these changes
resulted in $25, $43 and $37 increases in net environmental liabilities in 2007, 2006 and 2005, respectively. The Company currently
expects to continue to perform an evaluation of its environmental liabilities annually.
In reporting environmental results, the Company divides its gross exposure into Direct, which is subdivided further as: Accounts with
future exposure greater than $2.5, Accounts with future exposure less than $2.5, and Other direct; Assumed Reinsurance; and London
Market. The unallocated amounts in the Other direct category include an estimate of the necessary reserves for environmental claims
related to direct insureds who have not previously tendered environmental claims to the Company.
An account may move between categories from one evaluation to the next. For example, an account with future expected exposure of
greater than $2.5 in one evaluation may be reevaluated due to changing conditions and re-categorized as less than $2.5 in a subsequent
evaluation or vice versa.
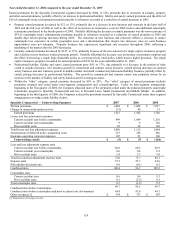
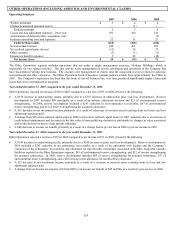
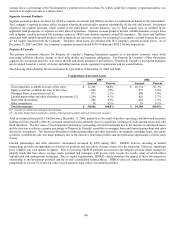
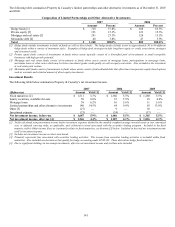
The following table displays gross environmental reserves and other statistics by category as of December 31, 2007.
Summary of Gross Environmental Reserves
As of December 31, 2007
Gross Environmental Reserves as of September 30, 2007 [1]
Number of
Accounts [2]
Total
Reserves
Accounts with future exposure > $2.5 8 $ 38
Accounts with future exposure < $2.5 520 100
Other direct [3] — 29
Total Direct 528 167
Assumed Reinsurance 87
London Market 47
Total gross environmental reserves as of September 30, 2007 [1] 301
Gross paid loss activity for the fourth quarter 2007 (12)
Gross incurred loss activity for the fourth quarter 2007 1
Total gross environmental reserves as of December 31, 2007 [4] [5] $290
[1] Gross Environmental Reserves based on the third quarter 2007 environmental reserve study.
[2] Number of accounts established as of June 2007.
[3] Includes unallocated IBNR.
[4] The one year gross paid amount for total environmental claims is $121, resulting in a one year gross survival ratio of 2.4.
[5] The three year average gross paid amount for total environmental claims is $108, resulting in a three year gross survival ratio of 2.7.
During the second quarter of 2007, an arbitration panel found that a Hartford subsidiary, established as a captive reinsurance company in
the 1970s by The Hartford's former parent, ITT, had additional obligations to ITT's primary insurance carrier under ITT's captive
insurance program, which ended in 1993. When ITT spun-off The Hartford in 1995, the former captive became a Hartford subsidiary.
The arbitration concerned whether certain claims could be presented to the former captive in a different manner than ITT’s primary
insurance carrier historically had presented them. Principally as a result of this adverse arbitration decision, the Company recorded a
charge of $99.
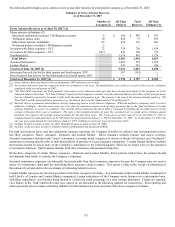
During the second quarters of 2007, 2006 and 2005, the Company completed its annual evaluations of the collectibility of the
reinsurance recoverables and the adequacy of the allowance for uncollectible reinsurance associated with older, long-term casualty
liabilities reported in the Other Operations segment. The evaluation in the second quarter of 2007 resulted in no addition to the
allowance for uncollectible reinsurance. In the second quarter of 2006, the Company entered into an agreement with Equitas and all
Lloyd’ s syndicates reinsured by Equitas (collectively, “Equitas”) that resolved, with minor exception, all of the Company’ s ceded and
assumed domestic reinsurance exposures with Equitas, including all of the Company’ s reinsurance recoveries from Equitas under the
Blanket Casualty Treaty (“BCT”). As a result of the settlement with Equitas and the 2006 reinsurance recoverable evaluation, the
Company reduced its net reinsurance recoverable by $243. As a result of the evaluation in the second quarter of 2005, the Company
increased its allowance for uncollectible reinsurance by $20 to reflect deterioration in the credit ratings of certain reinsurers and the
Company’ s opinion as to the ability of certain reinsurers to pay claims in the future.
In conducting these evaluations of reinsurance recoverables, the Company used its most recent detailed evaluations of ceded liabilities
reported in the segment. The Company analyzed the overall credit quality of the Company’ s reinsurers, recent trends in arbitration and
litigation outcomes in disputes between cedants and reinsurers, and recent developments in commutation activity between reinsurers and
cedants. In 2006 and 2007, the Company also considered the effect of the Equitas settlement on the collectibility of amounts due from
other upper-layer reinsurers under the BCT. The allowance for uncollectible reinsurance reflects management’s current estimate of
reinsurance cessions that may be uncollectible in the future due to reinsurers’ unwillingness or inability to pay. As of December 31,
2007, the allowance for uncollectible reinsurance for Other Operations totals $267. The Company currently expects to perform its
regular comprehensive review of Other Operations reinsurance recoverables annually. Uncertainties regarding the factors that affect the
allowance for uncollectible reinsurance could cause the Company to change its estimates, and the effect of these changes could be
material to the Company’ s consolidated results of operations or cash flows.