The Hartford 2007 Annual Report Download - page 163
Download and view the complete annual report
Please find page 163 of the 2007 The Hartford annual report below. You can navigate through the pages in the report by either clicking on the pages listed below, or by using the keyword search tool below to find specific information within the annual report.-
 1
1 -
2
-
3
-
4
-
5
-
6
-
7
-
8
-
9
-
10
-
11
-
12
-
13
-
14
-
15
-
16
-
17
-
18
-
19
-
20
-
21
-
22
-
23
-
24
-
25
-
26
-
27
-
28
-
29
-
30
-
31
-
32
-
33
-
34
-
35
-
36
-
37
-
38
-
39
-
40
-
41
-
42
-
43
-
44
-
45
-
46
-
47
-
48
-
49
-
50
-
51
-
52
-
53
-
54
-
55
-
56
-
57
-
58
-
59
-
60
-
61
-
62
-
63
-
64
-
65
-
66
-
67
-
68
-
69
-
70
-
71
-
72
-
73
-
74
-
75
-
76
-
77
-
78
-
79
-
80
-
81
-
82
-
83
-
84
-
85
-
86
-
87
-
88
-
89
-
90
-
91
-
92
-
93
-
94
-
95
-
96
-
97
-
98
-
99
-
100
-
101
-
102
-
103
-
104
-
105
-
106
-
107
-
108
-
109
-
110
-
111
-
112
-
113
-
114
-
115
-
116
-
117
-
118
-
119
-
120
-
121
-
122
-
123
-
124
-
125
-
126
-
127
-
128
-
129
-
130
-
131
-
132
-
133
-
134
-
135
-
136
-
137
-
138
-
139
-
140
-
141
-
142
-
143
-
144
-
145
-
146
-
147
-
148
-
149
-
150
-
151
-
152
-
 153
153 -
 154
154 -
 155
155 -
 156
156 -
 157
157 -
 158
158 -
 159
159 -
 160
160 -
 161
161 -
 162
162 -
 163
163 -
 164
164 -
 165
165 -
 166
166 -
 167
167 -
 168
168 -
 169
169 -
 170
170 -
 171
171 -
 172
172 -
 173
173 -
174
-
175
-
176
-
177
-
178
-
179
-
180
-
181
-
182
-
183
-
184
-
185
-
186
-
187
-
188
-
189
-
190
-
191
-
192
-
193
-
194
-
195
-
196
-
197
-
198
-
199
-
200
-
201
-
202
-
203
-
204
-
205
-
206
-
207
-
208
-
209
-
210
-
211
-
212
-
213
-
214
-
215
-
216
-
217
-
218
-
219
-
220
-
221
-
222
-
223
-
224
-
225
-
226
-
227
-
228
-
229
-
230
-
231
-
232
-
233
-
234
-
235
-
236
-
237
-
238
-
239
-
240
-
241
-
242
-
243
-
244
-
245
-
246
-
247
-
248
-
249
-
250
-
251
-
252
-
253
-
254
-
255
-
256
-
257
-
258
-
259
-
260
-
261
-
262
-
263
-
264
-
265
-
266
-
267
-
268
-
269
-
270
-
271
-
272
-
273
-
274
-
275
-
276
 |
 |

163
Company to currency risk. The Company manages this currency risk associated with the yen fixed annuities primarily with pay variable
U.S. dollar and receive fixed yen currency swaps. As of December 31, 2007 and 2006, the notional value and fair value of the currency
swaps were $1.8 billion and $1.9 billion, respectively, and $(115) and $(225), respectively. Although economically an effective hedge,
a divergence between the yen denominated fixed annuity product liability and the currency swaps exists primarily due to the difference
in the basis of accounting between the liability and the derivative instruments (i.e. historical cost versus fair value). The yen
denominated fixed annuity product liabilities are recorded on a historical cost basis and are only adjusted for changes in foreign spot
rates and accrued income. The currency swaps are recorded at fair value, incorporating changes in value due to changes in forward
foreign exchange rates, interest rates and accrued income. An after-tax net gain (loss) of $12 and $(11) for the years ended December
31, 2007 and 2006, respectively, which includes the changes in value of the currency swaps, excluding net periodic coupon settlements,
and the yen fixed annuity contract remeasurement, was recorded in net realized capital gains and losses.
Based on the fair values of Life’ s non-U.S. dollar denominated investments and derivative instruments (including its yen based
individual fixed annuity product) as of December 31, 2007 and 2006, management estimates that a 10% unfavorable change in exchange
rates would decrease the fair values by an after-tax total of $1 and $3, respectively. The estimated impact was based upon a 10% change
in December 31 spot rates. The selection of the 10% unfavorable change was made only for illustration of the potential hypothetical
impact of such an event and should not be construed as a prediction of future market events. Actual results could differ materially from
those illustrated above due to the nature of the estimates and assumptions used in the above analysis.
Property & Casualty
Property & Casualty attempts to maximize economic value while generating appropriate after-tax income and sufficient liquidity to
meet policyholder and corporate obligations. Property & Casualty’ s investment portfolio has material exposure to interest rates. The
Company continually monitors these exposures and makes portfolio adjustments to manage these risks within established limits.
Interest Rate Risk
The primary exposure to interest rate risk in Property & Casualty relates to its fixed maturity securities, including corporate bonds, ABS,
municipal bonds, CMBS and CMOs. The fair value of these investments was $27.2 billion and $26.7 billion at December 31, 2007 and
2006, respectively. The fair value of these and Property & Casualty’ s other invested assets fluctuates depending on the interest rate
environment and other general economic conditions. A variety of derivative instruments, primarily swaps, are used to manage interest
rate risk and had a total notional amount as of December 31, 2007 and 2006 of $1.8 billion and $2.1 billion, respectively, and fair value
of $(15) and $(4), respectively.
One of the measures Property & Casualty uses to quantify its exposure to interest rate risk inherent in its invested assets is duration. The
weighted average duration of the fixed maturity portfolio was 4.9 and 4.5 years as of December 31, 2007 and 2006, respectively.
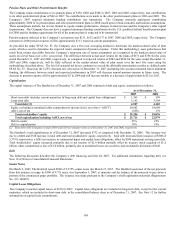
Calculated Interest Rate Sensitivity
The following table provides an analysis showing the estimated after-tax change in the fair value of Property & Casualty’ s fixed
maturity investments and related derivatives, assuming 100 basis point upward and downward parallel shifts in the yield curve as of
December 31, 2007 and 2006. Certain financial instruments, such as limited partnerships, have been omitted from the analysis due to
the fact that the investments are accounted for under the equity method and generally lack sensitivity to interest rate changes.
Change in Fair Value As of December 31,
2007 2006
Basis point shift - 100 + 100 - 100 + 100
Amount $ 925 $ (894) $ 857 $ (829)
The selection of the 100 basis point parallel shift in the yield curve was made only as an illustration of the potential hypothetical impact
of such an event and should not be construed as a prediction of future market events. Actual results could differ materially from those
illustrated above due to the nature of the estimates and assumptions used in the above analysis. The Company’ s sensitivity analysis
calculation assumes that the composition of invested assets remains materially consistent throughout the year and that the current
relationship between short-term and long-term interest rates will remain constant over time. As a result, these calculations may not fully
capture the impact of portfolio re-allocations or non-parallel changes in interest rates.
Foreign Currency Exchange Risk
Foreign currency exchange risk exists with respect to investments in non-U.S. dollar denominated fixed maturities, primarily euro,
sterling and Canadian dollar denominated securities. The risk associated with these securities relates to potential decreases in value
resulting from unfavorable changes in foreign exchange rates. The fair value of these fixed maturity securities at December 31, 2007
and 2006 was $1.0 billion.
In order to manage its currency exposures, Property & Casualty enters into foreign currency swaps and forward contracts to hedge the
variability in cash flow associated with certain foreign denominated securities. These foreign currency swap agreements are structured
to match the foreign currency cash flows of the hedged foreign denominated securities. At December 31, 2007 and 2006, the derivatives
used to hedge currency exchange risk had a total notional value of $428 and $805, respectively, and total fair value of $(43) and $(45),
respectively.