The Hartford 2007 Annual Report Download - page 169
Download and view the complete annual report
Please find page 169 of the 2007 The Hartford annual report below. You can navigate through the pages in the report by either clicking on the pages listed below, or by using the keyword search tool below to find specific information within the annual report.-
 1
1 -
2
-
3
-
4
-
5
-
6
-
7
-
8
-
9
-
10
-
11
-
12
-
13
-
14
-
15
-
16
-
17
-
18
-
19
-
20
-
21
-
22
-
23
-
24
-
25
-
26
-
27
-
28
-
29
-
30
-
31
-
32
-
33
-
34
-
35
-
36
-
37
-
38
-
39
-
40
-
41
-
42
-
43
-
44
-
45
-
46
-
47
-
48
-
49
-
50
-
51
-
52
-
53
-
54
-
55
-
56
-
57
-
58
-
59
-
60
-
61
-
62
-
63
-
64
-
65
-
66
-
67
-
68
-
69
-
70
-
71
-
72
-
73
-
74
-
75
-
76
-
77
-
78
-
79
-
80
-
81
-
82
-
83
-
84
-
85
-
86
-
87
-
88
-
89
-
90
-
91
-
92
-
93
-
94
-
95
-
96
-
97
-
98
-
99
-
100
-
101
-
102
-
103
-
104
-
105
-
106
-
107
-
108
-
109
-
110
-
111
-
112
-
113
-
114
-
115
-
116
-
117
-
118
-
119
-
120
-
121
-
122
-
123
-
124
-
125
-
126
-
127
-
128
-
129
-
130
-
131
-
132
-
133
-
134
-
135
-
136
-
137
-
138
-
139
-
140
-
141
-
142
-
143
-
144
-
145
-
146
-
147
-
148
-
149
-
150
-
151
-
152
-
153
-
154
-
155
-
156
-
157
-
158
-
 159
159 -
 160
160 -
 161
161 -
 162
162 -
 163
163 -
 164
164 -
 165
165 -
 166
166 -
 167
167 -
 168
168 -
 169
169 -
 170
170 -
 171
171 -
 172
172 -
 173
173 -
 174
174 -
 175
175 -
 176
176 -
 177
177 -
 178
178 -
 179
179 -
180
-
181
-
182
-
183
-
184
-
185
-
186
-
187
-
188
-
189
-
190
-
191
-
192
-
193
-
194
-
195
-
196
-
197
-
198
-
199
-
200
-
201
-
202
-
203
-
204
-
205
-
206
-
207
-
208
-
209
-
210
-
211
-
212
-
213
-
214
-
215
-
216
-
217
-
218
-
219
-
220
-
221
-
222
-
223
-
224
-
225
-
226
-
227
-
228
-
229
-
230
-
231
-
232
-
233
-
234
-
235
-
236
-
237
-
238
-
239
-
240
-
241
-
242
-
243
-
244
-
245
-
246
-
247
-
248
-
249
-
250
-
251
-
252
-
253
-
254
-
255
-
256
-
257
-
258
-
259
-
260
-
261
-
262
-
263
-
264
-
265
-
266
-
267
-
268
-
269
-
270
-
271
-
272
-
273
-
274
-
275
-
276
 |
 |

169
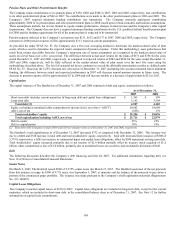
Consumer Notes
Institutional Solutions Group began issuing Consumer Notes through its Retail Investor Notes Program in September 2006. A
Consumer Note is an investment product distributed through broker-dealers directly to retail investors as medium-term, publicly traded
fixed or floating rate, or a combination of fixed and floating rate, notes. In addition, discount notes, amortizing notes and indexed notes
may also be offered and issued. Consumer Notes are part of the Company’s spread-based business and proceeds are used to purchase
investment products, primarily fixed rate bonds. Proceeds are not used for general operating purposes. Consumer Notes are offered
weekly with maturities up to 30 years and varying interest rates and may include a call provision. Certain Consumer Notes may be
redeemed by the holder in the event of death. Redemptions are subject to certain limitations, including calendar year aggregate and
individual limits equal to the greater of $1 or 1% of the aggregate principal amount of the notes and $250 thousand per individual,
respectively. Derivative instruments will be utilized to hedge the Company’s exposure to interest rate risk in accordance with Company
policy.
As of December 31, 2007 and 2006, $809 and $258 of consumer notes had been issued. These notes have interest rates ranging from
4.75% to 6.25% for fixed notes and for variable notes, either consumer price index plus 157 basis points to 267 basis points, or indexed
to the S&P 500, Dow Jones Industrials or the Nikkei 225. The aggregate maturities of consumer notes are as follows: $222 in 2008,
$494 in 2009, $34 in 2010, $19 in 2011 and $40 thereafter. For 2007 and 2006, interest credited to holders of consumer notes was $11
and $2, respectively.
Stockholders’ Equity
Treasury stock acquired — For the year ended December 31, 2007, The Hartford repurchased $1.2 billion of its common stock (12.9
million shares) under its share repurchase program. For additional information regarding the share repurchase program, see the
Liquidity Requirements section above.
Dividends — On February 21, 2008, The Hartford’ s Board of Directors declared a quarterly dividend of $0.53 per share payable on
April 1, 2008 to shareholders of record as of March 3, 2008.
The Hartford declared $643 and paid $636 in dividends to shareholders in 2007 and declared $531 and paid $460 in dividends to
shareholders in 2006.
AOCI – AOCI, net of tax, decreased by $1.0 billion as of December 31, 2007 compared with December 31, 2006. The decrease in
AOCI, net of tax, includes unrealized losses on securities of $1.4 billion, primarily due to widening credit spreads associated with fixed
maturities, partially offset by changes in gains on cash-flow hedging instruments of $94, change in foreign currency translation
adjustments of $146, and pension and other postretirement plan adjustments of $141. Because The Hartford's investment portfolio has a
duration of approximately 5 years, a 100 basis point parallel movement in rates would result in approximately a 5% change in fair value.
Movements in short-term interest rates without corresponding changes in long-term rates will impact the fair value of our fixed
maturities to a lesser extent than parallel interest rate movements.
For additional information on stockholders’ equity, AOCI, net of tax, and pension and other postretirement plans see Notes 15, 16 and
17, respectively, of Notes to Consolidated Financial Statements.
Cash Flow
2007 2006 2005
Net cash provided by operating activities $5,991 $ 5,638 $3,732
Net cash used for investing activities $(6,176) $ (7,410) $(4,860)
Net cash provided by financing activities $499 $ 1,915 $1,280
Cash - end of year $2,011 $ 1,424 $1,273
Year ended December 31, 2007 compared to the year ended December 31, 2006
The increase in cash from operating activities compared to prior year period was primarily the result of premium cash flows in excess of
claim payments, partially offset by increases in taxes paid. Net purchases of available-for-sale securities continue to account for the
majority of cash used for investing activities. Cash from financing activities decreased primarily due to treasury stock acquired and
increases in dividends paid; partially offset by higher net receipts from policyholder’ s accounts related to investment and universal life
contracts, proceeds from consumer notes, and issuance of long-term debt, net of repayments.
Year ended December 31, 2006 compared to the year ended December 31, 2005
The increase in cash from operating activities was primarily the result of premium cash flows in excess of claim payments and increased
net income as compared to prior year period. Net purchases of available-for-sale securities accounted for the majority of cash used for
investing activities. Cash provided by financing activities increased primarily due to higher net receipts from policyholder’ s accounts
related to investment and universal life contracts, proceeds from issuance of consumer notes and proceeds from issuance of shares from
equity unit contracts, less the portion that was used for debt repayments.
Operating cash flows in each of the last three years have been adequate to meet liquidity requirements.