The Hartford 2007 Annual Report Download - page 105
Download and view the complete annual report
Please find page 105 of the 2007 The Hartford annual report below. You can navigate through the pages in the report by either clicking on the pages listed below, or by using the keyword search tool below to find specific information within the annual report.-
 1
1 -
2
-
3
-
4
-
5
-
6
-
7
-
8
-
9
-
10
-
11
-
12
-
13
-
14
-
15
-
16
-
17
-
18
-
19
-
20
-
21
-
22
-
23
-
24
-
25
-
26
-
27
-
28
-
29
-
30
-
31
-
32
-
33
-
34
-
35
-
36
-
37
-
38
-
39
-
40
-
41
-
42
-
43
-
44
-
45
-
46
-
47
-
48
-
49
-
50
-
51
-
52
-
53
-
54
-
55
-
56
-
57
-
58
-
59
-
60
-
61
-
62
-
63
-
64
-
65
-
66
-
67
-
68
-
69
-
70
-
71
-
72
-
73
-
74
-
75
-
76
-
77
-
78
-
79
-
80
-
81
-
82
-
83
-
84
-
85
-
86
-
87
-
88
-
89
-
90
-
91
-
92
-
93
-
94
-
 95
95 -
 96
96 -
 97
97 -
 98
98 -
 99
99 -
 100
100 -
 101
101 -
 102
102 -
 103
103 -
 104
104 -
 105
105 -
 106
106 -
 107
107 -
 108
108 -
 109
109 -
 110
110 -
 111
111 -
 112
112 -
 113
113 -
 114
114 -
 115
115 -
116
-
117
-
118
-
119
-
120
-
121
-
122
-
123
-
124
-
125
-
126
-
127
-
128
-
129
-
130
-
131
-
132
-
133
-
134
-
135
-
136
-
137
-
138
-
139
-
140
-
141
-
142
-
143
-
144
-
145
-
146
-
147
-
148
-
149
-
150
-
151
-
152
-
153
-
154
-
155
-
156
-
157
-
158
-
159
-
160
-
161
-
162
-
163
-
164
-
165
-
166
-
167
-
168
-
169
-
170
-
171
-
172
-
173
-
174
-
175
-
176
-
177
-
178
-
179
-
180
-
181
-
182
-
183
-
184
-
185
-
186
-
187
-
188
-
189
-
190
-
191
-
192
-
193
-
194
-
195
-
196
-
197
-
198
-
199
-
200
-
201
-
202
-
203
-
204
-
205
-
206
-
207
-
208
-
209
-
210
-
211
-
212
-
213
-
214
-
215
-
216
-
217
-
218
-
219
-
220
-
221
-
222
-
223
-
224
-
225
-
226
-
227
-
228
-
229
-
230
-
231
-
232
-
233
-
234
-
235
-
236
-
237
-
238
-
239
-
240
-
241
-
242
-
243
-
244
-
245
-
246
-
247
-
248
-
249
-
250
-
251
-
252
-
253
-
254
-
255
-
256
-
257
-
258
-
259
-
260
-
261
-
262
-
263
-
264
-
265
-
266
-
267
-
268
-
269
-
270
-
271
-
272
-
273
-
274
-
275
-
276
 |
 |
105
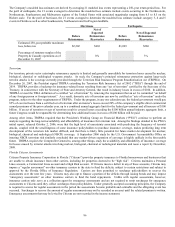
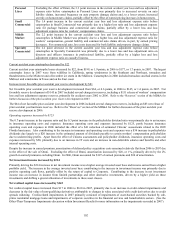
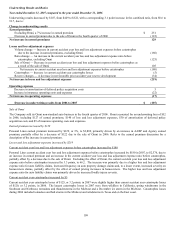
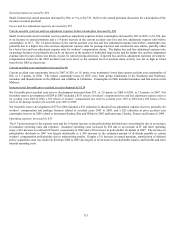
Operating expenses decreased by $35
The 0.9 point decrease in the expense ratio, to 25.6, was primarily due to a decrease in insurance operating costs and expenses.
Insurance operating costs decreased by $141, largely because of a $41 decrease in estimated Citizens’ assessments in 2006 compared to
a $64 increase in Citizens assessments in 2005. Almost all of the Citizens assessments were for assessments charged by the Citizens
Property Insurance Corporation (Citizens) in Florida, a company established by the State of Florida to provide personal and commercial
insurance to individuals and businesses in Florida who are in high risk areas of the state and are unable to obtain insurance through the
private insurance markets. Amortization of deferred policy acquisition costs increased by $106, due largely to the increase in earned
premium.
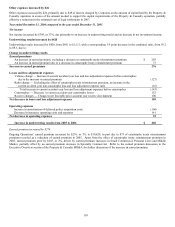
Net investment income increased by $143
The $143 increase in net investment income was primarily because of a larger investment base due to increased cash flows from
underwriting and an increase in capital and invested assets attributed to Ongoing Operations as well as an increase in interest rates and a
change in asset mix (i.e., a greater share of investments in mortgage loans and limited partnerships).
A change from $19 of realized capital gains in 2005 to $17 of net realized capital losses in 2006
The $17 in net realized capital losses during 2006 included a $24 pre-tax realized capital loss from the sale of Omni, an increase in
other-than-temporary-impairments and losses on the sale of fixed maturity investments, partially offset by an increase in income from
other sources. (See the Other-Than-Temporary Impairments discussion within Investment Results for more information on the increase
in impairments).
Other expenses increased by $20
Other expenses increased by $20, primarily due to lower bad debt expense in 2005.