The Hartford 2007 Annual Report Download - page 49
Download and view the complete annual report
Please find page 49 of the 2007 The Hartford annual report below. You can navigate through the pages in the report by either clicking on the pages listed below, or by using the keyword search tool below to find specific information within the annual report.-
 1
1 -
2
-
3
-
4
-
5
-
6
-
7
-
8
-
9
-
10
-
11
-
12
-
13
-
14
-
15
-
16
-
17
-
18
-
19
-
20
-
21
-
22
-
23
-
24
-
25
-
26
-
27
-
28
-
29
-
30
-
31
-
32
-
33
-
34
-
35
-
36
-
37
-
38
-
 39
39 -
 40
40 -
 41
41 -
 42
42 -
 43
43 -
 44
44 -
 45
45 -
 46
46 -
 47
47 -
 48
48 -
 49
49 -
 50
50 -
 51
51 -
 52
52 -
 53
53 -
 54
54 -
 55
55 -
 56
56 -
 57
57 -
 58
58 -
 59
59 -
60
-
61
-
62
-
63
-
64
-
65
-
66
-
67
-
68
-
69
-
70
-
71
-
72
-
73
-
74
-
75
-
76
-
77
-
78
-
79
-
80
-
81
-
82
-
83
-
84
-
85
-
86
-
87
-
88
-
89
-
90
-
91
-
92
-
93
-
94
-
95
-
96
-
97
-
98
-
99
-
100
-
101
-
102
-
103
-
104
-
105
-
106
-
107
-
108
-
109
-
110
-
111
-
112
-
113
-
114
-
115
-
116
-
117
-
118
-
119
-
120
-
121
-
122
-
123
-
124
-
125
-
126
-
127
-
128
-
129
-
130
-
131
-
132
-
133
-
134
-
135
-
136
-
137
-
138
-
139
-
140
-
141
-
142
-
143
-
144
-
145
-
146
-
147
-
148
-
149
-
150
-
151
-
152
-
153
-
154
-
155
-
156
-
157
-
158
-
159
-
160
-
161
-
162
-
163
-
164
-
165
-
166
-
167
-
168
-
169
-
170
-
171
-
172
-
173
-
174
-
175
-
176
-
177
-
178
-
179
-
180
-
181
-
182
-
183
-
184
-
185
-
186
-
187
-
188
-
189
-
190
-
191
-
192
-
193
-
194
-
195
-
196
-
197
-
198
-
199
-
200
-
201
-
202
-
203
-
204
-
205
-
206
-
207
-
208
-
209
-
210
-
211
-
212
-
213
-
214
-
215
-
216
-
217
-
218
-
219
-
220
-
221
-
222
-
223
-
224
-
225
-
226
-
227
-
228
-
229
-
230
-
231
-
232
-
233
-
234
-
235
-
236
-
237
-
238
-
239
-
240
-
241
-
242
-
243
-
244
-
245
-
246
-
247
-
248
-
249
-
250
-
251
-
252
-
253
-
254
-
255
-
256
-
257
-
258
-
259
-
260
-
261
-
262
-
263
-
264
-
265
-
266
-
267
-
268
-
269
-
270
-
271
-
272
-
273
-
274
-
275
-
276
 |
 |
49
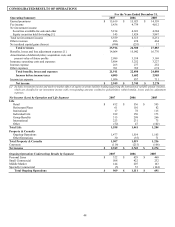
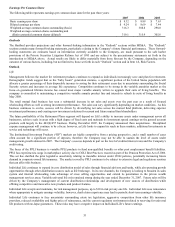
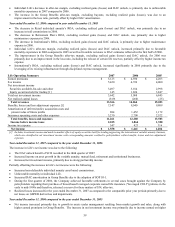
Operating Results
Year ended December 31, 2007 compared to the year ended December 31, 2006
Net income increased primarily due to increases in Life of $117 for the year ended December 31, 2007 compared to the year ended
December 31, 2006. Additionally, Property & Casualty net income decreased $12 for the year ended December 31, 2007 compared to
the year ended December 31, 2006. Also included in the year ended December 31, 2007 is an increase in reserve for regulatory matters
of $30, after-tax, of which $21 and $9 relates to Life and Property & Casualty, respectively.
The increase in Life’ s net income was due to the following:
• The DAC unlock benefit of $210 recorded in the third quarter of 2007.
• Increased income on asset growth in the variable annuity, mutual fund, retirement and institutional businesses.
• Increased net investment income, primarily due to strong partnership income.
Partially offsetting the increase in Life’ s net income were the following:
• Increased non-deferrable individual annuity asset based commissions.
• Unfavorable mortality in Individual Life.
• Increased DAC amortization in Group Benefits due to the adoption of Statement of Position 05-1, “Accounting by Insurance
Enterprises for Deferred Acquisition Costs in Connection with Modifications or Exchanges of Insurance Contracts” (“SOP 05-1”).
• During the first quarter of 2006, the Company achieved favorable settlements in several cases brought against the Company by
policyholders regarding their purchase of broad-based leveraged corporate owned life insurance ("leveraged COLI") policies in the
early to mid-1990s and therefore, released a reserve for these matters of $34, after-tax.
• Realized losses increased for the year ended December 31, 2007 as compared to the comparable prior year periods primarily due to
net losses on GMWB derivatives and impairments.
Property & Casualty net income decreased by $12 for the year ended December 31, 2007. Ongoing Operations’ net income decreased
by $77 for the year while Other Operations improved its results by $65, primarily due to a reduction in unfavorable loss reserve
development.
• Ongoing Operations’ net income decreased by $77, primarily due to a $92 after-tax decrease in underwriting results and a change
from net realized capital gains of $29, after-tax, in 2006 to net realized capital losses of $104, after-tax, in 2007. The decrease in
underwriting results and the change to net realized capital losses was partially offset by a $150 after-tax increase in net investment
income. The decrease in underwriting results was primarily driven by an increase in the loss and loss adjustment expense ratio
before catastrophes and prior accident year development and an increase in insurance and operating costs and dividends, partially
offset by a reduction in prior accident year reserves for workers’ compensation business.
• Other Operations reported net income of $30 in 2007 compared to a net loss of $35 in 2006. The improvement in results was
primarily due to a decrease in unfavorable prior accident year reserve development, partially offset by a change from net realized
gains in 2006 to net realized losses in 2007 and a decrease in net investment income.
Year ended December 31, 2006 compared to the year ended December 31, 2005
Net income increased primarily due to increases in Property & Casualty of $283 and in Life of $237 for the year ended December 31,
2006 compared to the year ended December 31, 2005.
Property & Casualty net income increased $283, as a result of a $389 increase in Ongoing Operations’ net income, partially offset by a
decrease in Other Operations’ results from net income of $71 in 2005 to a net loss of $35 in 2006.
• Ongoing Operations’ net income increased due to increases in underwriting results and net investment income, partially offset by a
decrease in net realized capital gains. The increase in Ongoing Operations’ underwriting results was principally due to lower
current accident year catastrophe losses, lower insurance operating costs and expenses due to a change in estimated Florida Citizens
assessments, a change to net favorable prior accident year loss development and the effect of catastrophe treaty reinstatement
premium recorded as a reduction of earned premium in 2005.
• The net loss in Other Operations was primarily a result of prior year reserve development of $243, pre-tax, recorded in 2006,
resulting from the agreement with Equitas and the Company’ s evaluation of the reinsurance recoverables and allowance for
uncollectible reinsurance associated with older, long-term casualty liabilities.
Life’ s net income increased $237 primarily due to growth in assets under management resulting from market growth and strong sales
along with higher earned premiums. Also contributing to Life’ s increased net income were the following:
• During 2006, the Company achieved favorable settlements in several cases brought against the Company by policyholders
regarding their purchase of broad-based leveraged corporate owned life insurance policies in the early to mid-1990s. The Company
reduced its estimate of the ultimate cost of these cases in 2006. This reserve reduction resulted in an after-tax benefit of $34.
• A charge of $102, after-tax, recorded in 2005 in Life to reserve for investigations related to market timing by the SEC and New
York Attorney General’ s Office, directed brokerage by the SEC and single premium group annuities by the New York Attorney
General’ s Office and the Connecticut Attorney General’ s Office.