The Hartford 2007 Annual Report Download - page 84
Download and view the complete annual report
Please find page 84 of the 2007 The Hartford annual report below. You can navigate through the pages in the report by either clicking on the pages listed below, or by using the keyword search tool below to find specific information within the annual report.-
 1
1 -
2
-
3
-
4
-
5
-
6
-
7
-
8
-
9
-
10
-
11
-
12
-
13
-
14
-
15
-
16
-
17
-
18
-
19
-
20
-
21
-
22
-
23
-
24
-
25
-
26
-
27
-
28
-
29
-
30
-
31
-
32
-
33
-
34
-
35
-
36
-
37
-
38
-
39
-
40
-
41
-
42
-
43
-
44
-
45
-
46
-
47
-
48
-
49
-
50
-
51
-
52
-
53
-
54
-
55
-
56
-
57
-
58
-
59
-
60
-
61
-
62
-
63
-
64
-
65
-
66
-
67
-
68
-
69
-
70
-
71
-
72
-
73
-
 74
74 -
 75
75 -
 76
76 -
 77
77 -
 78
78 -
 79
79 -
 80
80 -
 81
81 -
 82
82 -
 83
83 -
 84
84 -
 85
85 -
 86
86 -
 87
87 -
 88
88 -
 89
89 -
 90
90 -
 91
91 -
 92
92 -
 93
93 -
 94
94 -
95
-
96
-
97
-
98
-
99
-
100
-
101
-
102
-
103
-
104
-
105
-
106
-
107
-
108
-
109
-
110
-
111
-
112
-
113
-
114
-
115
-
116
-
117
-
118
-
119
-
120
-
121
-
122
-
123
-
124
-
125
-
126
-
127
-
128
-
129
-
130
-
131
-
132
-
133
-
134
-
135
-
136
-
137
-
138
-
139
-
140
-
141
-
142
-
143
-
144
-
145
-
146
-
147
-
148
-
149
-
150
-
151
-
152
-
153
-
154
-
155
-
156
-
157
-
158
-
159
-
160
-
161
-
162
-
163
-
164
-
165
-
166
-
167
-
168
-
169
-
170
-
171
-
172
-
173
-
174
-
175
-
176
-
177
-
178
-
179
-
180
-
181
-
182
-
183
-
184
-
185
-
186
-
187
-
188
-
189
-
190
-
191
-
192
-
193
-
194
-
195
-
196
-
197
-
198
-
199
-
200
-
201
-
202
-
203
-
204
-
205
-
206
-
207
-
208
-
209
-
210
-
211
-
212
-
213
-
214
-
215
-
216
-
217
-
218
-
219
-
220
-
221
-
222
-
223
-
224
-
225
-
226
-
227
-
228
-
229
-
230
-
231
-
232
-
233
-
234
-
235
-
236
-
237
-
238
-
239
-
240
-
241
-
242
-
243
-
244
-
245
-
246
-
247
-
248
-
249
-
250
-
251
-
252
-
253
-
254
-
255
-
256
-
257
-
258
-
259
-
260
-
261
-
262
-
263
-
264
-
265
-
266
-
267
-
268
-
269
-
270
-
271
-
272
-
273
-
274
-
275
-
276
 |
 |
84
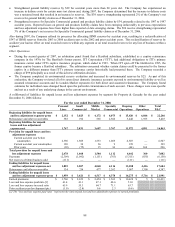
including fluctuations in interest rates and the level of prepayments. The Company also invests in equity securities, mortgage loans and
limited partnership arrangements.
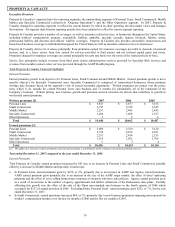
Property & Casualty's insurance business has been written by a number of writing companies that, under a pooling arrangement,
participate in the Hartford Fire Insurance Pool, the lead company of which is the Hartford Fire Insurance Company (“Hartford Fire”).
Property & Casualty maintains one portfolio of invested assets for all business written by the Hartford Fire Insurance Pool companies,
including business reported in both the Ongoing Operations and Other Operations segments. Separate investment portfolios are
maintained within Other Operations for the runoff of international assumed reinsurance claims and for the runoff business of Heritage
Holdings, Inc., including its subsidiaries, Excess Insurance Company Ltd., First State Insurance Company and Heritage Reinsurance
Company, Ltd. Within the Hartford Fire Insurance Pool, invested assets are attributed to Ongoing Operations and Other Operations
pursuant to the Company’ s capital attribution process.
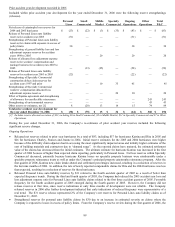
The Hartford attributes capital to each line of business or segment using an internally-developed, risk-based capital attribution
methodology that incorporates management’ s assessment of the relative risks within each line of business or segment, as well as the
capital requirements of external parties, such as regulators and rating agencies. Net investment income earned on the Hartford Fire
invested asset portfolio is allocated between Ongoing Operations and Other Operations based on the allocation of invested assets to each
segment and the expected investment yields earned by each segment. Net investment income earned on the separate portfolios within
Other Operations is recorded entirely within Other Operations. Based on the Company's method of allocating net investment income for
the Hartford Fire Insurance Pool and the net investment income earned by Other Operations on its separate investment portfolios, in
2007, the after-tax investment yield for Ongoing Operations was 4.6% and the after-tax investment yield for Other Operations was
3.3%.
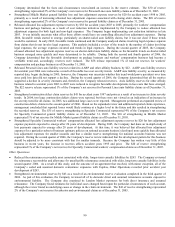
Net realized capital gains (losses)
When fixed maturity or equity investments are sold, any gain or loss is reported in net realized capital gains (losses). Individual
securities may be sold for a variety of reasons, including a decision to change the Company’ s asset allocation in response to market
conditions and the need to liquidate funds to meet large claim settlements. Accordingly, net realized capital gains (losses) for any
particular period are not predictable and can vary significantly. In addition, net realized capital gains (losses) include other-than-
temporary impairments in the fair value of investments, changes in the fair value of non-qualifying derivatives and hedge ineffectiveness
on qualifying derivative instruments. Refer to the Investment section of MD&A for further discussion of net investment income and net
realized capital gains (losses).
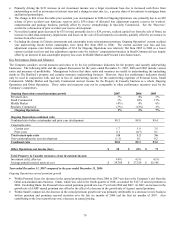
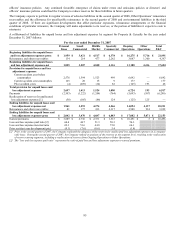
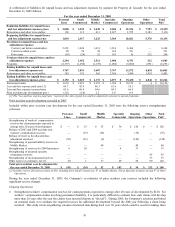
Reserves
Reserving for property and casualty losses is an estimation process. As additional experience and other relevant claim data become
available, reserve levels are adjusted accordingly. Such adjustments of reserves related to claims incurred in prior years are a natural
occurrence in the loss reserving process and are referred to as “reserve development”. Reserve development that increases previous
estimates of ultimate cost is called “reserve strengthening”. Reserve development that decreases previous estimates of ultimate cost is
called “reserve releases”. Reserve development can influence the comparability of year over year underwriting results and is set forth in
the paragraphs and tables that follow. The “prior accident year development (pts.)” in the following table represents the ratio of reserve
development to earned premiums. For a detailed discussion of the Company’ s reserve policies, see Notes 1, 11 and 12 of Notes to
Consolidated Financial Statements and the Critical Accounting Estimates section of the MD&A.
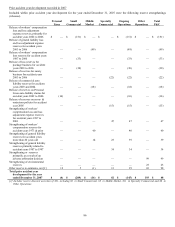
Based on the results of the quarterly reserve review process, the Company determines the appropriate reserve adjustments, if any, to
record. Recorded reserve estimates are changed after consideration of numerous factors, including but not limited to, the magnitude of
the difference between the actuarial indication and the recorded reserves, improvement or deterioration of actuarial indications in the
period, the maturity of the accident year, trends observed over the recent past and the level of volatility within a particular line of
business. In general, changes are made more quickly to more mature accident years and less volatile lines of business. For information
regarding reserving for asbestos and environmental claims within Other Operations, refer to the Other Operations segment discussion.
As part of its quarterly reserve review process, the Company is closely monitoring reported loss development in certain lines where the
recent emergence of paid losses and case reserves could indicate a trend that may eventually lead the Company to change its estimate of
ultimate losses in those lines. If, and when, the emergence of reported losses is determined to be a trend that changes the Company's
estimate of ultimate losses, prior accident year reserves would be adjusted in the period the change in estimate is made.
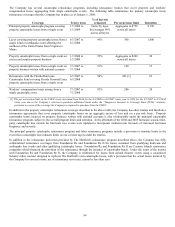
For example, the Company has experienced favorable emergence of reported workers’ compensation claims for recent accident years
and, during 2007, released workers' compensation reserves in Small Commercial for the 2002 to 2006 accident years by $151. If
reported losses on workers' compensation claims for recent accident years continue to emerge favorably, reserves could be reduced
further.
During 2007, the Company experienced favorable emergence of losses on professional liability claims for recent accident years and,
during the fourth quarter of 2007, released professional liability reserves by $15, largely due to a decrease in the estimated cost to settle
claims under errors and omissions policies in the 2005 accident year. In addition, reported losses for claims under directors’ and
officers’ insurance policies are emerging favorably to initial expectations although it is too early to tell if this trend will be sustained.
Up until the fourth quarter of 2007, there had been a decrease in the number of shareholders’ class action suits under directors’ and