The Hartford 2007 Annual Report Download - page 88
Download and view the complete annual report
Please find page 88 of the 2007 The Hartford annual report below. You can navigate through the pages in the report by either clicking on the pages listed below, or by using the keyword search tool below to find specific information within the annual report.-
 1
1 -
2
-
3
-
4
-
5
-
6
-
7
-
8
-
9
-
10
-
11
-
12
-
13
-
14
-
15
-
16
-
17
-
18
-
19
-
20
-
21
-
22
-
23
-
24
-
25
-
26
-
27
-
28
-
29
-
30
-
31
-
32
-
33
-
34
-
35
-
36
-
37
-
38
-
39
-
40
-
41
-
42
-
43
-
44
-
45
-
46
-
47
-
48
-
49
-
50
-
51
-
52
-
53
-
54
-
55
-
56
-
57
-
58
-
59
-
60
-
61
-
62
-
63
-
64
-
65
-
66
-
67
-
68
-
69
-
70
-
71
-
72
-
73
-
74
-
75
-
76
-
77
-
 78
78 -
 79
79 -
 80
80 -
 81
81 -
 82
82 -
 83
83 -
 84
84 -
 85
85 -
 86
86 -
 87
87 -
 88
88 -
 89
89 -
 90
90 -
 91
91 -
 92
92 -
 93
93 -
 94
94 -
 95
95 -
 96
96 -
 97
97 -
 98
98 -
99
-
100
-
101
-
102
-
103
-
104
-
105
-
106
-
107
-
108
-
109
-
110
-
111
-
112
-
113
-
114
-
115
-
116
-
117
-
118
-
119
-
120
-
121
-
122
-
123
-
124
-
125
-
126
-
127
-
128
-
129
-
130
-
131
-
132
-
133
-
134
-
135
-
136
-
137
-
138
-
139
-
140
-
141
-
142
-
143
-
144
-
145
-
146
-
147
-
148
-
149
-
150
-
151
-
152
-
153
-
154
-
155
-
156
-
157
-
158
-
159
-
160
-
161
-
162
-
163
-
164
-
165
-
166
-
167
-
168
-
169
-
170
-
171
-
172
-
173
-
174
-
175
-
176
-
177
-
178
-
179
-
180
-
181
-
182
-
183
-
184
-
185
-
186
-
187
-
188
-
189
-
190
-
191
-
192
-
193
-
194
-
195
-
196
-
197
-
198
-
199
-
200
-
201
-
202
-
203
-
204
-
205
-
206
-
207
-
208
-
209
-
210
-
211
-
212
-
213
-
214
-
215
-
216
-
217
-
218
-
219
-
220
-
221
-
222
-
223
-
224
-
225
-
226
-
227
-
228
-
229
-
230
-
231
-
232
-
233
-
234
-
235
-
236
-
237
-
238
-
239
-
240
-
241
-
242
-
243
-
244
-
245
-
246
-
247
-
248
-
249
-
250
-
251
-
252
-
253
-
254
-
255
-
256
-
257
-
258
-
259
-
260
-
261
-
262
-
263
-
264
-
265
-
266
-
267
-
268
-
269
-
270
-
271
-
272
-
273
-
274
-
275
-
276
 |
 |

88
• Strengthened general liability reserves by $39 for accident years more than 20 years old. The Company has experienced an
increase in defense costs for certain mass tort claims and, during 2007, the Company determined that the increase in defense costs
was a sustained trend that resulted in an increase in reserves. The $39 reserve strengthening represented 2% of the Company’ s net
reserves for general liability claims as of December 31, 2006.
• Strengthened reserves for Specialty Commercial general and products liability claims by $34, primarily related to the 1987 to 1997
accident years. Reported losses on general and products liability claims have been emerging unfavorably to previous expectations
and loss adjustment expenses have been higher than expected on late emerging claims. The $34 reserve strengthening represented
3% of the Company’s net reserves for Specialty Commercial general liability claims as of December 31, 2006.
Also during 2007, the Company refined its processes for allocating IBNR reserves by accident year, resulting in a reclassification of
$347 of IBNR reserves from the 2003 to 2006 accident years to the 2002 and prior accident years. This reclassification of reserves by
accident year had no effect on total recorded reserves within any segment or on total recorded reserves for any line of business within a
segment.
Other Operations
• During the second quarter of 2007, an arbitration panel found that a Hartford subsidiary, established as a captive reinsurance
company in the 1970s by The Hartford's former parent, ITT Corporation (“ITT”), had additional obligations to ITT's primary
insurance carrier under ITT's captive insurance program, which ended in 1993. When ITT spun off The Hartford in 1995, the
former captive became a Hartford subsidiary. The arbitration concerned whether certain claims could be presented to the former
captive in a different manner than ITT’ s primary insurance carrier historically had presented them. The Company recorded a
charge of $99 principally as a result of this adverse arbitration decision.
• The Company completed its environmental reserve evaluation and increased its environmental reserves by $25. As part of this
evaluation, the Company reviewed all of its open direct domestic insurance accounts exposed to environmental liability as well as
assumed reinsurance accounts and its London Market exposures for both direct and assumed reinsurance. The Company found
estimates for individual cases changed based upon the particular circumstances of each account. These changes were case specific
and not as a result of any underlying change in the current environment.
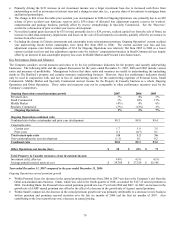
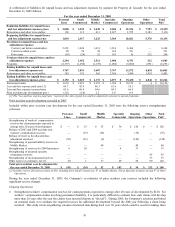
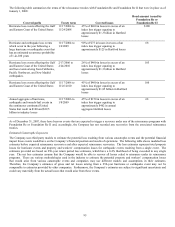
A rollforward of liabilities for unpaid losses and loss adjustment expenses by segment for Property & Casualty for the year ended
December 31, 2006 follows:
For the year ended December 31, 2006
Personal
Lines
Small
Commercial
Middle
Market
Specialty
Commercial
Ongoing
Operations
Other
Operations
Total
P&C
Beginning liabilities for unpaid losses
and loss adjustment expenses-gross
$
2,152
$
3,023
$
4,172
$
6,073 $
15,420
$
6,846
$ 22,266
Reinsurance and other recoverables 385 192 565 2,306 3,448 1,955 5,403
Beginning liabilities for unpaid
losses and loss adjustment
expenses-net
1,767 2,831
3,607 3,767 11,972 4,891 16,863
Provision for unpaid losses and loss
adjustment expenses
Current accident year before
catastrophes
2,396
1,509
1,533
1,069
6,507
—
6,507
Current accident year catastrophes 120 34 36 9 199 — 199
Prior years (38) (75) 15 34 (64) 360 296
Total provision for unpaid losses and
loss adjustment expenses
2,478
1,468
1,584
1,112
6,642
360
7,002
Payments (2,309) (1,092) (1,151) (763) (5,315) (835) (6,150)
Net reserves of Omni business sold (111) — — — (111) — (111)
Ending liabilities for unpaid losses
and loss adjustment expenses-net
1,825 3,207
4,040 4,116 13,188 4,416 17,604
Reinsurance and other recoverables 134 214 477 2,262 3,087 1,300 4,387
Ending liabilities for unpaid losses
and loss adjustment expenses-gross
$
1,959
$
3,421
$
4,517
$
6,378 $
16,275
$
5,716
$
21,991
Earned premiums $ 3,760 $2,652 $ 2,454 $ 1,562 $ 10,428 $ 5 $ 10,433
Loss and loss expense paid ratio [1] 61.4 41.1 47.1 48.6 51.0
Loss and loss expense incurred ratio 65.9 55.3 64.7 71.1 63.7
Prior accident year development (pts.) (1.0) (2.8) 0.6 2.3 (0.6)
[1] The “loss and loss expense paid ratio” represents the ratio of paid loss and loss adjustment expenses to earned premiums.