The Hartford 2007 Annual Report Download - page 70
Download and view the complete annual report
Please find page 70 of the 2007 The Hartford annual report below. You can navigate through the pages in the report by either clicking on the pages listed below, or by using the keyword search tool below to find specific information within the annual report.-
 1
1 -
2
-
3
-
4
-
5
-
6
-
7
-
8
-
9
-
10
-
11
-
12
-
13
-
14
-
15
-
16
-
17
-
18
-
19
-
20
-
21
-
22
-
23
-
24
-
25
-
26
-
27
-
28
-
29
-
30
-
31
-
32
-
33
-
34
-
35
-
36
-
37
-
38
-
39
-
40
-
41
-
42
-
43
-
44
-
45
-
46
-
47
-
48
-
49
-
50
-
51
-
52
-
53
-
54
-
55
-
56
-
57
-
58
-
59
-
 60
60 -
 61
61 -
 62
62 -
 63
63 -
 64
64 -
 65
65 -
 66
66 -
 67
67 -
 68
68 -
 69
69 -
 70
70 -
 71
71 -
 72
72 -
 73
73 -
 74
74 -
 75
75 -
 76
76 -
 77
77 -
 78
78 -
 79
79 -
 80
80 -
81
-
82
-
83
-
84
-
85
-
86
-
87
-
88
-
89
-
90
-
91
-
92
-
93
-
94
-
95
-
96
-
97
-
98
-
99
-
100
-
101
-
102
-
103
-
104
-
105
-
106
-
107
-
108
-
109
-
110
-
111
-
112
-
113
-
114
-
115
-
116
-
117
-
118
-
119
-
120
-
121
-
122
-
123
-
124
-
125
-
126
-
127
-
128
-
129
-
130
-
131
-
132
-
133
-
134
-
135
-
136
-
137
-
138
-
139
-
140
-
141
-
142
-
143
-
144
-
145
-
146
-
147
-
148
-
149
-
150
-
151
-
152
-
153
-
154
-
155
-
156
-
157
-
158
-
159
-
160
-
161
-
162
-
163
-
164
-
165
-
166
-
167
-
168
-
169
-
170
-
171
-
172
-
173
-
174
-
175
-
176
-
177
-
178
-
179
-
180
-
181
-
182
-
183
-
184
-
185
-
186
-
187
-
188
-
189
-
190
-
191
-
192
-
193
-
194
-
195
-
196
-
197
-
198
-
199
-
200
-
201
-
202
-
203
-
204
-
205
-
206
-
207
-
208
-
209
-
210
-
211
-
212
-
213
-
214
-
215
-
216
-
217
-
218
-
219
-
220
-
221
-
222
-
223
-
224
-
225
-
226
-
227
-
228
-
229
-
230
-
231
-
232
-
233
-
234
-
235
-
236
-
237
-
238
-
239
-
240
-
241
-
242
-
243
-
244
-
245
-
246
-
247
-
248
-
249
-
250
-
251
-
252
-
253
-
254
-
255
-
256
-
257
-
258
-
259
-
260
-
261
-
262
-
263
-
264
-
265
-
266
-
267
-
268
-
269
-
270
-
271
-
272
-
273
-
274
-
275
-
276
 |
 |
70
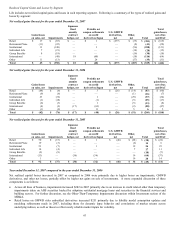
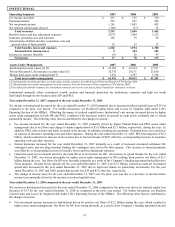
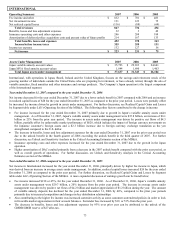
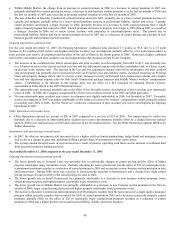
Year ended December 31, 2006 compared to the year ended December 31, 2005
Net income in Individual Life for 2006 decreased due to the unlock expense in the fourth quarter of 2006. In addition, realized capital
losses increased $42 for the year ended December 31, 2006 as compared to the prior year period. For further discussion, see Realized
Capital Gains and Losses by Segment table under Life’ s Operating Section of the MD&A. Offsetting these losses, net income increased
primarily due to growth in life insurance and account values, and favorable mortality experience in 2006 compared to 2005 as well as $7
of after-tax, favorable revisions to prior year net DAC estimates reflected in the first half of 2006. The following other factors
contributed to the changes in income:
• Cost of insurance charges, the largest component of fee income, increased $30 for the year ended December 31, 2006, driven by
growth in the variable universal and universal life insurance in-force. Variable fee income increased, consistent with the growth in
the variable universal life insurance account value. Other fee income, another component of total fee income, increased primarily
due to additional amortization of deferred revenues associated with the unlock.
• Earned premiums, which include premiums for ceded reinsurance, decreased primarily due to increased ceded reinsurance
premiums for the year ended December 31, 2006.
• Net investment income increased primarily due to increased general account assets from sales growth.
• Benefits, losses and loss adjustment expenses increased for 2006 consistent with the growth in account values and life insurance in-
force, and also reflect favorable mortality experience in 2006 compared to 2005.
• Insurance operating costs and other expenses increased for the year ended December 31, 2006 consistent with the growth of life
insurance in-force.
• Amortization of DAC for the year ended December 31, 2006 increased related to the unlock expense, partially offset by revisions to
prior year estimates. Excluding the impacts of the unlock expense and revisions, the amortization of DAC decreased for the year
ended December 31, 2006, consistently with the mix of products and the level and mix of product profitability. For further
discussion, see Unlock and Sensitivity Analysis in the Critical Accounting Estimates section of the MD&A.
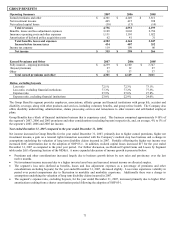
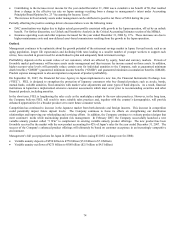
Outlook
Individual Life operates in a mature and competitive marketplace with customers desiring products with guarantees and distribution
requiring highly trained insurance professionals. Individual Life continues to expand its core distribution model of sales through
financial advisors and banks, while also pursuing growth opportunities through other distribution sources such as life brokerage. In its
core channels, the Company is looking to broaden its sales system and internal wholesaling, take advantage of cross selling
opportunities and extend its penetration in the private wealth management services areas. The Company is committed to maintaining a
competitive product portfolio and intends to refresh its variable universal and universal life insurance products in 2008.
Sales results for the year ended December 31, 2007 were strong across core distribution channels, including wirehouses/regional broker
dealers and banks. The variable universal life mix remains strong at 45% of total sales for 2007. Future sales will be driven by the
Company’s management of current distribution relationships and development of new sources of distribution while offering competitive
and innovative new products and product features.
Individual Life accepts and maintains, for risk management purposes, up to $10 in risk on any one life. Individual Life uses reinsurance
where appropriate to mitigate earnings volatility; however, death claim experience may lead to periodic short-term earnings volatility.
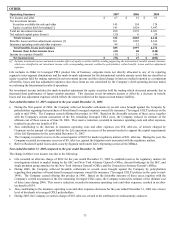
Effective November 1, 2007, Individual Life reinsured the policy liability related to statutory reserves in universal life with secondary
guarantees to a captive reinsurance subsidiary. These reserves are calculated under prevailing statutory reserving requirements as
promulgated under Actuarial Guideline 38, “The Application of the Valuation of Life Insurance Policies Model Regulation”. An
unaffiliated standby third party letter of credit supports a portion of the statutory reserves that have been ceded to this subsidiary. The
transaction released approximately $300 of statutory capital previously supporting our universal life products with secondary
guarantees. The release of this capital from Individual Life will result in a decline in net investment income and increased expenses in
future periods for Individual Life. The released capital is available to the Company for general corporate purposes. As its business
grow, from time to time, Individual Life will evaluate the need for an additional capital structure.
Individual Life continues to face uncertainty surrounding estate tax legislation, aggressive competition from other life insurance
providers, reduced availability and higher price of reinsurance, and the current regulatory environment related to reserving for universal
life products with no-lapse guarantees. These risks may have a negative impact on Individual Life’ s future earnings.
Management’ s current full year life insurance in-force projection for 2008 is an increase of 8% to 9%.