The Hartford 2007 Annual Report Download - page 35
Download and view the complete annual report
Please find page 35 of the 2007 The Hartford annual report below. You can navigate through the pages in the report by either clicking on the pages listed below, or by using the keyword search tool below to find specific information within the annual report.-
 1
1 -
2
-
3
-
4
-
5
-
6
-
7
-
8
-
9
-
10
-
11
-
12
-
13
-
14
-
15
-
16
-
17
-
18
-
19
-
20
-
21
-
22
-
23
-
24
-
 25
25 -
 26
26 -
 27
27 -
 28
28 -
 29
29 -
 30
30 -
 31
31 -
 32
32 -
 33
33 -
 34
34 -
 35
35 -
 36
36 -
 37
37 -
 38
38 -
 39
39 -
 40
40 -
 41
41 -
 42
42 -
 43
43 -
 44
44 -
 45
45 -
46
-
47
-
48
-
49
-
50
-
51
-
52
-
53
-
54
-
55
-
56
-
57
-
58
-
59
-
60
-
61
-
62
-
63
-
64
-
65
-
66
-
67
-
68
-
69
-
70
-
71
-
72
-
73
-
74
-
75
-
76
-
77
-
78
-
79
-
80
-
81
-
82
-
83
-
84
-
85
-
86
-
87
-
88
-
89
-
90
-
91
-
92
-
93
-
94
-
95
-
96
-
97
-
98
-
99
-
100
-
101
-
102
-
103
-
104
-
105
-
106
-
107
-
108
-
109
-
110
-
111
-
112
-
113
-
114
-
115
-
116
-
117
-
118
-
119
-
120
-
121
-
122
-
123
-
124
-
125
-
126
-
127
-
128
-
129
-
130
-
131
-
132
-
133
-
134
-
135
-
136
-
137
-
138
-
139
-
140
-
141
-
142
-
143
-
144
-
145
-
146
-
147
-
148
-
149
-
150
-
151
-
152
-
153
-
154
-
155
-
156
-
157
-
158
-
159
-
160
-
161
-
162
-
163
-
164
-
165
-
166
-
167
-
168
-
169
-
170
-
171
-
172
-
173
-
174
-
175
-
176
-
177
-
178
-
179
-
180
-
181
-
182
-
183
-
184
-
185
-
186
-
187
-
188
-
189
-
190
-
191
-
192
-
193
-
194
-
195
-
196
-
197
-
198
-
199
-
200
-
201
-
202
-
203
-
204
-
205
-
206
-
207
-
208
-
209
-
210
-
211
-
212
-
213
-
214
-
215
-
216
-
217
-
218
-
219
-
220
-
221
-
222
-
223
-
224
-
225
-
226
-
227
-
228
-
229
-
230
-
231
-
232
-
233
-
234
-
235
-
236
-
237
-
238
-
239
-
240
-
241
-
242
-
243
-
244
-
245
-
246
-
247
-
248
-
249
-
250
-
251
-
252
-
253
-
254
-
255
-
256
-
257
-
258
-
259
-
260
-
261
-
262
-
263
-
264
-
265
-
266
-
267
-
268
-
269
-
270
-
271
-
272
-
273
-
274
-
275
-
276
 |
 |
35
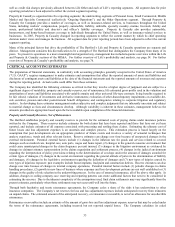
include workers’ compensation, general liability, and professional liability. Assumed reinsurance, which is within Other Operations, is
also long-tail business.
For short-tail lines of business, emergence of paid loss and case reserves is credible and likely indicative of ultimate losses. For long-
tail lines of business, emergence of paid losses and case reserves is less credible in the early periods and, accordingly, may not be
indicative of ultimate losses.
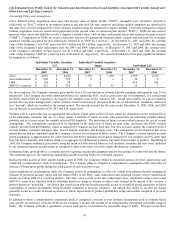
An expected loss ratio is used in initially recording the reserves for both short-tail and long-tail lines of business. This expected loss
ratio is determined through a review of prior accident years’ loss ratios and expected changes to earned pricing, loss costs, mix of
business, ceded reinsurance and other factors that are expected to impact the loss ratio for the current accident year. For short-tail lines,
IBNR for the current accident year is initially recorded as the product of the expected loss ratio for the period, earned premium for the
period and the proportion of losses expected to be reported in future calendar periods for the current accident period. For long-tailed
lines, IBNR reserves for the current accident year are initially recorded as the product of the expected loss ratio for the period and the
earned premium for the period, less reported losses for the period.
Company reserving actuaries, who are independent of the business units, regularly review reserves for both current and prior accident
years using the most current claim data. These reserve reviews incorporate a variety of actuarial methods and judgments and involve
rigorous analysis. Most non-A&E reserves are reviewed fully each quarter, including loss reserves for property, auto physical damage,
auto liability, package business, workers’ compensation, most general liability, professional liability and fidelity and surety. Other non-
A&E reserves are reviewed semi-annually (twice per year) or annually. These include, but are not limited to, reserves for losses
incurred before 1987, allocated loss adjustment expenses, assumed reinsurance, latent exposures such as construction defects,
unallocated loss adjustment expense and all other non-A&E exposures within Other Operations. For reserves that are reviewed semi-
annually and annually, management monitors the emergence of paid and reported losses in the intervening quarters to either confirm that
its estimate of ultimate losses should not change or, if necessary, perform a reserve review to determine whether the reserve estimate
should change.
For most lines of business, a variety of actuarial methods are reviewed and the actuaries select methods and specific assumptions
appropriate for each line of business based on the current circumstances affecting that line of business. These selections incorporate
input, as judged by the reserving actuaries to be appropriate, from claims personnel, pricing actuaries and operating management on
reported loss cost trends and other factors that could affect the reserve estimates. The output of the reserve reviews are reserve estimates
that are referred to herein as the “actuarial indication”.
The actuarial techniques or methods used primarily include paid and reported loss development, frequency / severity, expected loss ratio
and Bornhuetter-Ferguson techniques. Within any one line of business, a variety of techniques are used. Within any one line of
business, certain methods are generally given more influence in determining the actuarial indication. The methods that are given more
influence vary within a line of business based primarily on the maturity of the accident year, the mix of business and the particular
internal and external influences impacting the claims experience or the methods. The following is a discussion of the most common
methods used; these methods are not used for every line of business or every accident year within a line of business.
Paid Development method. Historical data, organized by accident period and calendar period, is used to develop paid loss development
patterns, which are then applied to current paid losses by accident period to estimate ultimate losses. The paid development method is
also used to estimate reserves for allocated loss adjustments expenses (“ALAE”).
Paid development techniques do not use information about case reserves and, therefore, are not affected by changes in case reserving
practices. Paid development techniques can, however, be significantly affected by changes in claim closure patterns. Paid development
techniques for longer-tailed lines are generally less useful for more recent accident years since a low percentage of ultimate losses are
paid to date in early periods of development and small changes in paid losses can have a large impact on estimated ultimate losses.
Reported Development method. Historical data, organized by accident period and calendar period, is used to develop reported loss
development patterns, which are then applied to current reported losses by accident period to estimate ultimate losses. The reported
losses used in this analysis refer to cumulative paid losses plus case reserves and do not include IBNR.
Compared to the paid development technique, the reported development technique has the advantage that a higher percentage of
ultimate losses are reflected in reported losses than in cumulative paid losses. The reported development technique estimates only the
unreported losses rather than the total unpaid losses. While the reported development technique takes advantage of information
contained in the case reserves, estimates determined from this technique are affected by changes in case reserving practices.
Both paid and reported development techniques assume that historical development patterns are predictive of future development
patterns.
Frequency / Severity methods. Historical data is used to develop claim count development patterns and those patterns are applied to the
number of current reported claims to estimate ultimate claim counts. Estimated ultimate claim counts are multiplied by an estimated
average severity (i.e., an average cost per claim) to calculate estimated ultimate losses. Average severity is estimated by fitting
historical severity data to a trend line and making assumptions about how the current environment would affect claim severity. In
making assumptions about the current environment, industry data is used where such data is available and appropriate.