The Hartford 2007 Annual Report Download - page 71
Download and view the complete annual report
Please find page 71 of the 2007 The Hartford annual report below. You can navigate through the pages in the report by either clicking on the pages listed below, or by using the keyword search tool below to find specific information within the annual report.-
 1
1 -
2
-
3
-
4
-
5
-
6
-
7
-
8
-
9
-
10
-
11
-
12
-
13
-
14
-
15
-
16
-
17
-
18
-
19
-
20
-
21
-
22
-
23
-
24
-
25
-
26
-
27
-
28
-
29
-
30
-
31
-
32
-
33
-
34
-
35
-
36
-
37
-
38
-
39
-
40
-
41
-
42
-
43
-
44
-
45
-
46
-
47
-
48
-
49
-
50
-
51
-
52
-
53
-
54
-
55
-
56
-
57
-
58
-
59
-
60
-
 61
61 -
 62
62 -
 63
63 -
 64
64 -
 65
65 -
 66
66 -
 67
67 -
 68
68 -
 69
69 -
 70
70 -
 71
71 -
 72
72 -
 73
73 -
 74
74 -
 75
75 -
 76
76 -
 77
77 -
 78
78 -
 79
79 -
 80
80 -
 81
81 -
82
-
83
-
84
-
85
-
86
-
87
-
88
-
89
-
90
-
91
-
92
-
93
-
94
-
95
-
96
-
97
-
98
-
99
-
100
-
101
-
102
-
103
-
104
-
105
-
106
-
107
-
108
-
109
-
110
-
111
-
112
-
113
-
114
-
115
-
116
-
117
-
118
-
119
-
120
-
121
-
122
-
123
-
124
-
125
-
126
-
127
-
128
-
129
-
130
-
131
-
132
-
133
-
134
-
135
-
136
-
137
-
138
-
139
-
140
-
141
-
142
-
143
-
144
-
145
-
146
-
147
-
148
-
149
-
150
-
151
-
152
-
153
-
154
-
155
-
156
-
157
-
158
-
159
-
160
-
161
-
162
-
163
-
164
-
165
-
166
-
167
-
168
-
169
-
170
-
171
-
172
-
173
-
174
-
175
-
176
-
177
-
178
-
179
-
180
-
181
-
182
-
183
-
184
-
185
-
186
-
187
-
188
-
189
-
190
-
191
-
192
-
193
-
194
-
195
-
196
-
197
-
198
-
199
-
200
-
201
-
202
-
203
-
204
-
205
-
206
-
207
-
208
-
209
-
210
-
211
-
212
-
213
-
214
-
215
-
216
-
217
-
218
-
219
-
220
-
221
-
222
-
223
-
224
-
225
-
226
-
227
-
228
-
229
-
230
-
231
-
232
-
233
-
234
-
235
-
236
-
237
-
238
-
239
-
240
-
241
-
242
-
243
-
244
-
245
-
246
-
247
-
248
-
249
-
250
-
251
-
252
-
253
-
254
-
255
-
256
-
257
-
258
-
259
-
260
-
261
-
262
-
263
-
264
-
265
-
266
-
267
-
268
-
269
-
270
-
271
-
272
-
273
-
274
-
275
-
276
 |
 |

71
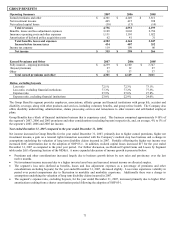
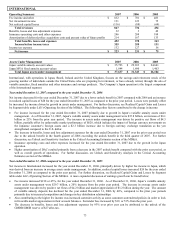
GROUP BENEFITS
Operating Summary 2007 2006 2005
Earned premiums and other $4,301 $ 4,149 $3,811
Net investment income 465 415 398
Net realized capital losses (30) (13) (10)
Total revenues 4,736 4,551 4,199
Benefits, losses and loss adjustment expenses 3,109 3,002 2,794
Insurance operating costs and other expenses 1,131 1,101 1,022
Amortization of deferred policy acquisition costs 62 41 31
Total benefits, losses and expenses 4,302 4,144 3,847
Income before income taxes 434 407 352
Income tax expense 119 109 86
Net income $315 $ 298 $266
Earned Premiums and Other 2007 2006 2005
Fully insured – ongoing premiums $4,239 $ 4,100 $ 3,747
Buyout premiums 27 12 27
Other 35 37 37
Total earned premiums and other $4,301 $ 4,149 $3,811
Ratios, excluding buyouts
Loss ratio 72.1% 72.3% 73.1%
Loss ratio, excluding financial institutions 77.3% 77.2% 77.3%
Expense ratio 27.9% 27.6% 27.8%
Expense ratio, excluding financial institutions 23.0% 22.9% 24.0%
The Group Benefits segment provides employers, associations, affinity groups and financial institutions with group life, accident and
disability coverage, along with other products and services, including voluntary benefits, and group retiree health. The Company also
offers disability underwriting, administration, claims processing services and reinsurance to other insurers and self-funded employer
plans.
Group Benefits has a block of financial institution business that is experience rated. This business comprised approximately 9-10% of
the segment’s 2007, 2006 and 2005 premiums and other considerations (excluding buyouts) respectively, and, on average, 4% to 5% of
the segment’ s 2007, 2006 and 2005 net income.
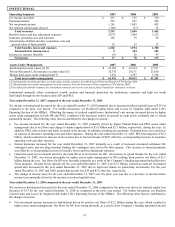
Year ended December 31, 2007 compared to the year ended December 31, 2006
Net income increased in Group Benefits for the year ended December 31, 2007, primarily due to higher earned premiums, higher net
investment income, a gain on a renewal rights transaction associated with the Company’ s medical stop loss business and a change in
assumptions underlying the valuation of long term disability claims incurred in 2007. Partially offsetting the higher net income was
increased DAC amortization due to the adoption of SOP 05-1. In addition, realized capital losses increased $17 for the year ended
December 31, 2007 as compared to the prior year period. For further discussion, see Realized Capital Gains and Losses by Segment
table under Life’ s Operating Section of the MD&A. A more expanded discussion of income growth is presented below:
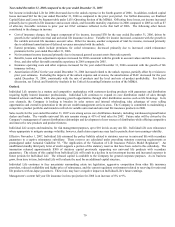
• Premiums and other considerations increased largely due to business growth driven by new sales and persistency over the last
twelve months.
• Net investment income increased due to a higher invested asset base and increased interest income on allocated surplus.
• The segment’ s loss ratio (defined as benefits, losses and loss adjustment expenses as a percentage of premiums and other
considerations excluding buyouts) for the year ended December 31, 2007, decreased slightly. Loss ratios experience volatility in
period over period comparisons due to fluctuation in mortality and morbidity experience. Additionally there was a change in
assumptions underlying the valuation of long term disability claims incurred in 2007.
• The segment’ s expense ratio, excluding buyouts, for the year ended December 31, 2007, increased primarily due to higher DAC
amortization resulting from a shorter amortization period following the adoption of SOP 05-1.