The Hartford 2007 Annual Report Download - page 217
Download and view the complete annual report
Please find page 217 of the 2007 The Hartford annual report below. You can navigate through the pages in the report by either clicking on the pages listed below, or by using the keyword search tool below to find specific information within the annual report.-
 1
1 -
2
-
3
-
4
-
5
-
6
-
7
-
8
-
9
-
10
-
11
-
12
-
13
-
14
-
15
-
16
-
17
-
18
-
19
-
20
-
21
-
22
-
23
-
24
-
25
-
26
-
27
-
28
-
29
-
30
-
31
-
32
-
33
-
34
-
35
-
36
-
37
-
38
-
39
-
40
-
41
-
42
-
43
-
44
-
45
-
46
-
47
-
48
-
49
-
50
-
51
-
52
-
53
-
54
-
55
-
56
-
57
-
58
-
59
-
60
-
61
-
62
-
63
-
64
-
65
-
66
-
67
-
68
-
69
-
70
-
71
-
72
-
73
-
74
-
75
-
76
-
77
-
78
-
79
-
80
-
81
-
82
-
83
-
84
-
85
-
86
-
87
-
88
-
89
-
90
-
91
-
92
-
93
-
94
-
95
-
96
-
97
-
98
-
99
-
100
-
101
-
102
-
103
-
104
-
105
-
106
-
107
-
108
-
109
-
110
-
111
-
112
-
113
-
114
-
115
-
116
-
117
-
118
-
119
-
120
-
121
-
122
-
123
-
124
-
125
-
126
-
127
-
128
-
129
-
130
-
131
-
132
-
133
-
134
-
135
-
136
-
137
-
138
-
139
-
140
-
141
-
142
-
143
-
144
-
145
-
146
-
147
-
148
-
149
-
150
-
151
-
152
-
153
-
154
-
155
-
156
-
157
-
158
-
159
-
160
-
161
-
162
-
163
-
164
-
165
-
166
-
167
-
168
-
169
-
170
-
171
-
172
-
173
-
174
-
175
-
176
-
177
-
178
-
179
-
180
-
181
-
182
-
183
-
184
-
185
-
186
-
187
-
188
-
189
-
190
-
191
-
192
-
193
-
194
-
195
-
196
-
197
-
198
-
199
-
200
-
201
-
202
-
203
-
204
-
205
-
206
-
 207
207 -
 208
208 -
 209
209 -
 210
210 -
 211
211 -
 212
212 -
 213
213 -
 214
214 -
 215
215 -
 216
216 -
 217
217 -
 218
218 -
 219
219 -
 220
220 -
 221
221 -
 222
222 -
 223
223 -
 224
224 -
 225
225 -
 226
226 -
 227
227 -
228
-
229
-
230
-
231
-
232
-
233
-
234
-
235
-
236
-
237
-
238
-
239
-
240
-
241
-
242
-
243
-
244
-
245
-
246
-
247
-
248
-
249
-
250
-
251
-
252
-
253
-
254
-
255
-
256
-
257
-
258
-
259
-
260
-
261
-
262
-
263
-
264
-
265
-
266
-
267
-
268
-
269
-
270
-
271
-
272
-
273
-
274
-
275
-
276
 |
 |

THE HARTFORD FINANCIAL SERVICES GROUP, INC.
NOTES TO CONSOLIDATED FINANCIAL STATEMENTS (continued)
F-40
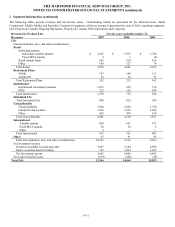
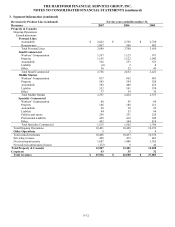
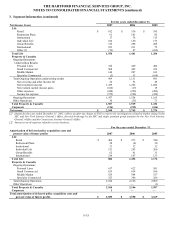
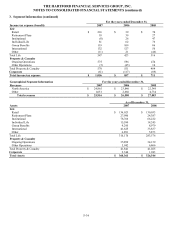
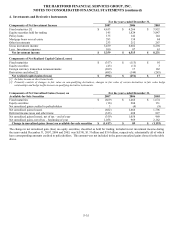
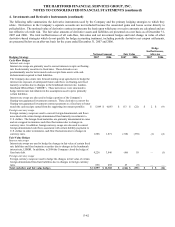
4. Investments and Derivative Instruments (continued)
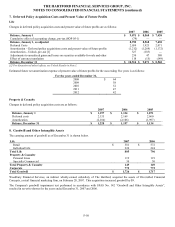
Variable Interest Entities (“VIE”)
In the normal course of business, the Company becomes involved with variable interest entities primarily as a collateral manager and
through normal investment activities. The Company’ s involvement includes providing investment management and administrative
services, and holding ownership or other investment interests in the entities.
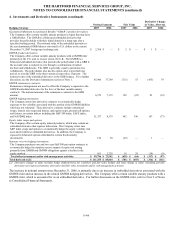
The following table summarizes the total assets, liabilities and maximum exposure to loss relating to VIEs for which the Company has
concluded it is the primary beneficiary. Accordingly, the results of operations and financial position of these VIEs are included along
with the corresponding minority interest liabilities in the accompanying consolidated financial statements.
December 31, 2007 December 31, 2006
Carrying
Value [1] Liability [2]
Maximum
Exposure to
Loss [3]
Carr
y
in
g
Value [1] Liability [2]
Maximum
Exposure to
Loss [3]
Collateralized loan obligations (“CLOs”)and
other funds [4] $ 359 $ 118 $ 258 $ 296 $ 99 $ 189
Limited partnerships 309 47 220 103 5 85
Other investments [5] 146 — 166 — — —
Total [6] $ 814 $ 165 $ 644 $ 399 $ 104 $ 274
[1] The carrying value of CLOs and other funds and Other investments is equal to fair value. Limited partnerships are accounted for under the
equity method.
[2] Creditors have no recourse against the Company in the event of default by the VIE.
[3] The maximum exposure to loss does not include changes in fair value or the Company’s proportionate shares of earnings associated with limited
partnerships accounted for under the equity method. The Company’s maximum exposure to loss as of December 31, 2007 and 2006 based on the
carrying value was $649 and $295, respectively. The Company’s maximum exposure to loss as of December 31, 2007 and 2006 based on the
Company’s initial co-investment or amortized cost basis was $644 and $274, respectively.
[4] The Company provides collateral management services and earns a fee associated with these structures.
[5] Other investments include investment structures that are backed by preferred securities.
[6] As of December 31, 2007 and 2006, the Company had relationships with seven and four VIEs, respectively, where the Company was the primary
beneficiary.
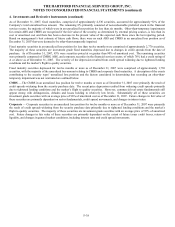
In addition to the VIEs described above, as of December 31, 2007 and 2006, the Company held variable interests in five and three
VIEs, respectively, where the Company is not the primary beneficiary and as a result, these are not consolidated by the Company. As
of December 31, 2007, these VIEs included two collateralized bond obligations and two CLOs which are managed by HIMCO, as well
as the Company’ s contingent capital facility. For further discussion of the contingent capital facility, see Note 14. These investments
have been held by the Company for a period of one to four years. The maximum exposure to loss consisting of the Company’ s
investments based on the amortized cost of the non-consolidated VIEs was approximately $150 and $20 as of December 31, 2007 and
2006, respectively. For the year ended December 31, 2007 the Company recognized $5 of the maximum exposure to loss representing
an other-than-temporary impairment recorded as a realized capital loss.
HIMCO is the collateral manager for four market value CLOs (included in the VIE discussion above) that invest in senior secured bank
loans through total return swaps. For two of the CLOs, the Company has determined it is the primary beneficiary and accordingly
consolidates the transactions. The maximum exposure to loss for these two consolidated CLOs, which is included in the $258 in the
“Collateral loan obligations and other funds” line in the table above, is $107 of which the Company has recognized a realized capital
loss of $26. The Company is not the primary beneficiary for the remaining two CLOs, but maintains a significant involvement in the
transactions. The maximum exposure to loss for these remaining two CLOs, included in the $150 in the preceding paragraph, is $37.
The CLOs have triggers that allow the total return swap counterparty to terminate the transactions if the fair value of the aggregate
referenced bank loan portfolio declines below a stated level.