The Hartford 2007 Annual Report Download - page 51
Download and view the complete annual report
Please find page 51 of the 2007 The Hartford annual report below. You can navigate through the pages in the report by either clicking on the pages listed below, or by using the keyword search tool below to find specific information within the annual report.-
 1
1 -
2
-
3
-
4
-
5
-
6
-
7
-
8
-
9
-
10
-
11
-
12
-
13
-
14
-
15
-
16
-
17
-
18
-
19
-
20
-
21
-
22
-
23
-
24
-
25
-
26
-
27
-
28
-
29
-
30
-
31
-
32
-
33
-
34
-
35
-
36
-
37
-
38
-
39
-
40
-
 41
41 -
 42
42 -
 43
43 -
 44
44 -
 45
45 -
 46
46 -
 47
47 -
 48
48 -
 49
49 -
 50
50 -
 51
51 -
 52
52 -
 53
53 -
 54
54 -
 55
55 -
 56
56 -
 57
57 -
 58
58 -
 59
59 -
 60
60 -
 61
61 -
62
-
63
-
64
-
65
-
66
-
67
-
68
-
69
-
70
-
71
-
72
-
73
-
74
-
75
-
76
-
77
-
78
-
79
-
80
-
81
-
82
-
83
-
84
-
85
-
86
-
87
-
88
-
89
-
90
-
91
-
92
-
93
-
94
-
95
-
96
-
97
-
98
-
99
-
100
-
101
-
102
-
103
-
104
-
105
-
106
-
107
-
108
-
109
-
110
-
111
-
112
-
113
-
114
-
115
-
116
-
117
-
118
-
119
-
120
-
121
-
122
-
123
-
124
-
125
-
126
-
127
-
128
-
129
-
130
-
131
-
132
-
133
-
134
-
135
-
136
-
137
-
138
-
139
-
140
-
141
-
142
-
143
-
144
-
145
-
146
-
147
-
148
-
149
-
150
-
151
-
152
-
153
-
154
-
155
-
156
-
157
-
158
-
159
-
160
-
161
-
162
-
163
-
164
-
165
-
166
-
167
-
168
-
169
-
170
-
171
-
172
-
173
-
174
-
175
-
176
-
177
-
178
-
179
-
180
-
181
-
182
-
183
-
184
-
185
-
186
-
187
-
188
-
189
-
190
-
191
-
192
-
193
-
194
-
195
-
196
-
197
-
198
-
199
-
200
-
201
-
202
-
203
-
204
-
205
-
206
-
207
-
208
-
209
-
210
-
211
-
212
-
213
-
214
-
215
-
216
-
217
-
218
-
219
-
220
-
221
-
222
-
223
-
224
-
225
-
226
-
227
-
228
-
229
-
230
-
231
-
232
-
233
-
234
-
235
-
236
-
237
-
238
-
239
-
240
-
241
-
242
-
243
-
244
-
245
-
246
-
247
-
248
-
249
-
250
-
251
-
252
-
253
-
254
-
255
-
256
-
257
-
258
-
259
-
260
-
261
-
262
-
263
-
264
-
265
-
266
-
267
-
268
-
269
-
270
-
271
-
272
-
273
-
274
-
275
-
276
 |
 |

51
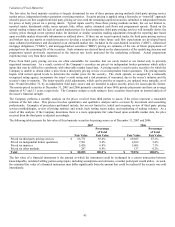
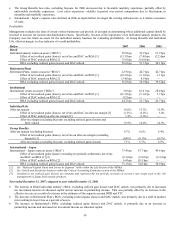
Earnings Per Common Share
The following table represents earnings per common share data for the past three years:
2007 2006 2005
Basic earnings per share $9.32 $ 8.89 $ 7.63
Diluted earnings per share $9.24 $ 8.69 $ 7.44
Weighted average common shares outstanding (basic) 316.3 308.8 298.0
Weighted average common shares outstanding and
dilutive potential common shares (diluted)
319.1
315.9
305.6
Outlooks
The Hartford provides projections and other forward-looking information in the “Outlook” sections within MD&A. The “Outlook”
sections contain many forward-looking statements, particularly relating to the Company’s future financial performance. These forward-
looking statements are estimates based on information currently available to the Company, are made pursuant to the safe harbor
provisions of the Private Securities Litigation Reform Act of 1995 and are subject to the precautionary statements set forth in the
introduction to MD&A above. Actual results are likely to differ materially from those forecast by the Company, depending on the
outcome of various factors, including, but not limited to, those set forth in each “Outlook” section and in Item 1A, Risk Factors.
Outlook
Life
Management believes the market for retirement products continues to expand as individuals increasingly save and plan for retirement.
Demographic trends suggest that as the “baby boom” generation matures, a significant portion of the United States population will
allocate a greater percentage of their disposable incomes to saving for their retirement years due to uncertainty surrounding the Social
Security system and increases in average life expectancy. Competition continues to be strong in the variable annuities market as the
focus on guaranteed lifetime income has caused most major variable annuity writers to upgrade their suite of living benefits. The
company is committed to maintaining a competitive variable annuity product line and intends to refresh its suite of living benefits in
May 2008.
The retail mutual fund business has seen a substantial increase in net sales and assets over the past year as a result of focused
wholesaling efforts as well as strong investment performance. Net sales can vary significantly depending on market conditions. As this
business continues to evolve, success will be driven by diversifying net sales across the mutual fund platform, delivering superior
investment performance and creating new investment solutions for current and future mutual fund shareholders.
The future profitability of the Retirement Plans segment will depend on Life’ s ability to increase assets under management across all
businesses, achieve scale in areas with a high degree of fixed costs and maintain its investment spread earnings on the general account
products sold largely in the 403(b)/457 business. During December 2007, the Company announced three acquisitions. Disciplined
expense management will continue to be a focus; however, as Life looks to expand its reach in these markets, additional investments in
service and technology will occur.
The Institutional Investment Products (“IIP”) markets are highly competitive from a pricing perspective, and a small number of cases
often account for a significant portion of deposits, therefore the Company may not be able to sustain the level of assets under
management growth attained in 2007. The Company’ s success depends in part on the level of credited interest rates and the Company’ s
credit rating.
The focus of the PPLI business is variable PPLI products to fund non-qualified benefits or other post employment benefit liabilities.
PPLI has experienced a surge in marketplace activity due to COLI Best Practices enacted as part of the Pension Protection Act of 2006.
This act has clarified the prior legislative uncertainty relating to insurable interest under COLI policies, potentially increasing future
demand in corporate owned life insurance. The market served by PPLI continues to be subject to extensive legal and regulatory scrutiny
that can affect this business.
Individual Life continues to expand its core distribution model of sales through financial advisors and banks, while also pursuing growth
opportunities through other distribution sources such as life brokerage. In its core channels, the Company is looking to broaden its sales
system and internal wholesaling, take advantage of cross selling opportunities and extend its penetration in the private wealth
management services areas. Variable universal life mix remained strong during the year ended December 31, 2007. Future sales will be
driven by the Company’ s management of current distribution relationships and development of new sources of distribution while
offering competitive and innovative new products and product features.
Individual Life accepts and maintains, for risk management purposes, up to $10 in risk per any one life. Individual Life uses reinsurance
where appropriate to mitigate earnings volatility; however, death claim experience may lead to periodic short-term earnings volatility.
Individual Life continues to face uncertainty surrounding estate tax legislation, aggressive competition from other life insurance
providers, reduced availability and higher price of reinsurance, and the current regulatory environment related to reserving for universal
life products with no-lapse guarantees. These risks may have a negative impact on Individual Life’ s future earnings.