The Hartford 2007 Annual Report Download - page 161
Download and view the complete annual report
Please find page 161 of the 2007 The Hartford annual report below. You can navigate through the pages in the report by either clicking on the pages listed below, or by using the keyword search tool below to find specific information within the annual report.-
 1
1 -
2
-
3
-
4
-
5
-
6
-
7
-
8
-
9
-
10
-
11
-
12
-
13
-
14
-
15
-
16
-
17
-
18
-
19
-
20
-
21
-
22
-
23
-
24
-
25
-
26
-
27
-
28
-
29
-
30
-
31
-
32
-
33
-
34
-
35
-
36
-
37
-
38
-
39
-
40
-
41
-
42
-
43
-
44
-
45
-
46
-
47
-
48
-
49
-
50
-
51
-
52
-
53
-
54
-
55
-
56
-
57
-
58
-
59
-
60
-
61
-
62
-
63
-
64
-
65
-
66
-
67
-
68
-
69
-
70
-
71
-
72
-
73
-
74
-
75
-
76
-
77
-
78
-
79
-
80
-
81
-
82
-
83
-
84
-
85
-
86
-
87
-
88
-
89
-
90
-
91
-
92
-
93
-
94
-
95
-
96
-
97
-
98
-
99
-
100
-
101
-
102
-
103
-
104
-
105
-
106
-
107
-
108
-
109
-
110
-
111
-
112
-
113
-
114
-
115
-
116
-
117
-
118
-
119
-
120
-
121
-
122
-
123
-
124
-
125
-
126
-
127
-
128
-
129
-
130
-
131
-
132
-
133
-
134
-
135
-
136
-
137
-
138
-
139
-
140
-
141
-
142
-
143
-
144
-
145
-
146
-
147
-
148
-
149
-
150
-
 151
151 -
 152
152 -
 153
153 -
 154
154 -
 155
155 -
 156
156 -
 157
157 -
 158
158 -
 159
159 -
 160
160 -
 161
161 -
 162
162 -
 163
163 -
 164
164 -
 165
165 -
 166
166 -
 167
167 -
 168
168 -
 169
169 -
 170
170 -
 171
171 -
172
-
173
-
174
-
175
-
176
-
177
-
178
-
179
-
180
-
181
-
182
-
183
-
184
-
185
-
186
-
187
-
188
-
189
-
190
-
191
-
192
-
193
-
194
-
195
-
196
-
197
-
198
-
199
-
200
-
201
-
202
-
203
-
204
-
205
-
206
-
207
-
208
-
209
-
210
-
211
-
212
-
213
-
214
-
215
-
216
-
217
-
218
-
219
-
220
-
221
-
222
-
223
-
224
-
225
-
226
-
227
-
228
-
229
-
230
-
231
-
232
-
233
-
234
-
235
-
236
-
237
-
238
-
239
-
240
-
241
-
242
-
243
-
244
-
245
-
246
-
247
-
248
-
249
-
250
-
251
-
252
-
253
-
254
-
255
-
256
-
257
-
258
-
259
-
260
-
261
-
262
-
263
-
264
-
265
-
266
-
267
-
268
-
269
-
270
-
271
-
272
-
273
-
274
-
275
-
276
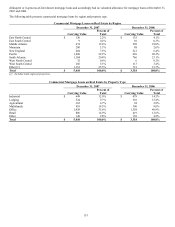
 |
 |

161
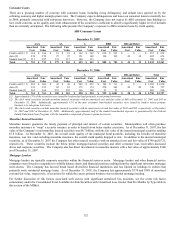
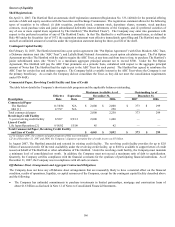
The Company uses hedging instruments to hedge its unreinsured GMWB exposure. These instruments include interest rate futures and
swaps, S&P 500 and NASDAQ index put options and futures contracts. The Company also uses EAFE Index swaps to hedge GMWB
exposure to international equity markets. The hedging program involves a detailed monitoring of policyholder behavior and capital
markets conditions on a daily basis and rebalancing of the hedge position as needed. While the Company actively manages this hedge
position, hedge ineffectiveness may result due to factors including, but not limited to, policyholder behavior, capital markets dislocation
or discontinuity and divergence between the performance of the underlying funds and the hedging indices.
The Company is continually exploring new ways and new markets to manage or layoff the capital markets and policyholder behavior
risks associated with its living benefits. During 2007, the Company opportunistically entered into two customized swap contracts to
hedge certain capital market risk components for the remaining term of certain blocks of non-reinsured GMWB riders. As of December
31, 2007, these swaps had a notional value of $12.8 billion and a market value of $50. Due to the significance of the non-observable
inputs associated with pricing these derivatives, the initial difference between the transaction price and modeled value was deferred in
accordance with EITF No. 02-3 “Issues Involved in Accounting for Derivative Contracts Held for Trading Purposes and Contracts
Involved in Energy Trading and Risk Management Activities” and included in other assets in the Consolidated Financial Statements.
The deferred loss of $51 will be recognized in retained earnings upon adoption of SFAS No. 157, “Fair Value Measurements” (“SFAS
157”). In addition, the change in value of the swaps due to the initial adoption of SFAS 157 of $35, will also be recorded in retained
earnings. Future changes in fair value would be recorded in net realized capital gains (losses) in net income.
The net effect of the change in value of the U.S. and UK embedded derivatives, net of the results of the hedging program, for the years
ended December 31, 2007 and 2006, was a loss of $285 (primarily reflecting modeling refinements, assumption changes and reflecting
newly reliable market inputs for volatility made by the Company during 2007) and $(26) before deferred policy acquisition costs and tax
effects, respectively. As of December 31, 2007, the notional and fair value related to the embedded derivatives, the hedging strategy
and reinsurance was $73.8 billion and $55, respectively. As of December 31, 2006, the notional and fair value related to the embedded
derivatives, the hedging strategy, and reinsurance was $53.3 billion and $377, respectively.
The Company employs additional strategies to manage equity market risk in addition to the derivative and reinsurance strategy
described above that economically hedges the fair value of the U.S. GMWB rider. Notably, the Company purchases one and two year
S&P 500 Index put option contracts to economically hedge certain other liabilities that could increase if the equity markets decline. As
of December 31, 2007 and December 31, 2006, the notional value related to this strategy was $661 and $2.2 billion, respectively, while
the fair value related to this strategy was $18 and $29, respectively. Because this strategy is intended to partially hedge certain equity-
market sensitive liabilities calculated under statutory accounting (see Capital Resources and Liquidity), changes in the value of the put
options may not be closely aligned to changes in liabilities determined in accordance with U.S. GAAP, causing volatility in U.S. GAAP
net income.
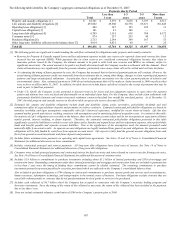
The Company continually seeks to improve its equity risk management strategies. The Company has made considerable investment in
analyzing current and potential future market risk exposures arising from a number of factors, including but not limited to, product
guarantees (GMDB, GMWB, GMAB, and GMIB), equity market and interest rate risks (in both the U.S. and Japan) and foreign
currency exchange rates. The Company evaluates these risks individually and, increasingly, in the aggregate to determine the risk
profiles of all of its products and to judge their potential impacts on U.S. GAAP net income, statutory capital volatility and other
metrics. Utilizing this and future analysis, the Company expects to evolve its risk management strategies over time, modifying its
reinsurance, hedging and product design strategies to optimally mitigate its aggregate exposures to market-driven changes in U.S.
GAAP equity, statutory capital and other economic metrics. Because these strategies could target an optimal reduction of a combination
of exposures rather than targeting a single one, it is possible that volatility of U.S. GAAP net income would increase, particularly if the
Company places an increased relative weight on protection of statutory surplus in future strategies.
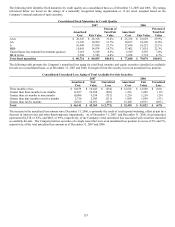
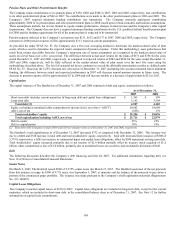
Variable Annuity Equity Risk Impact on Statutory Distributable Earnings
In addition to the impact on U.S. GAAP results, Life’ s statutory financial results also have exposure to equity market volatility due to
the issuance of variable annuity contracts with guarantees. Specifically, in scenarios where equity markets decline substantially, we
would expect lower statutory net income and significant increases in the amount of statutory surplus Life would have to devote to
maintain targeted rating agency, regulatory risk based capital (“RBC”) ratios and other similar solvency margin ratios. Life’ s statutory
net income for the years ended December 31, 2007, 2006 and 2005 was $729, $1.1 billion and $821, respectively. Life’ s statutory
surplus as of December 31, 2007, 2006 and 2005 was $5.8 billion, $4.7 billion and $4.3 billion, respectively. In order to estimate the
impact equity markets could have on statutory financial results, Life projected 2008 statutory net income and the amount of statutory
surplus required to maintain our financial strength ratings (targeted statutory surplus) under various stochastic scenarios and
assumptions consistent with other sensitivity analyses performed by Life. Each scenario included the effects of guaranteed living and
death benefit reinsurance, in-force hedging assets in place at December 31, 2007 and future dynamic hedging of GMWB riders. The
sum of Life’ s projected 2008 statutory net income and the (increase) decrease in the amount of targeted statutory surplus in each
scenario is an estimate of the Life’ s “statutory distributable earnings”. Subject to legal or regulatory constraints, statutory distributable
earnings are usually available to dividend to an insurance entity’ s parent holding company to support debt and dividend payments to
shareholders. To illustrate the effects of a tail scenario, at or near the 95th percentile, Life estimates that 2008 statutory distributable
earnings generated by its variable annuity business could be $1 - $2 billion worse than the mean of the stochastic scenarios. These tail
events involve U.S. equity market declines of varying degrees, including rather large equity market declines of 20-25% from December