The Hartford 2007 Annual Report Download - page 37
Download and view the complete annual report
Please find page 37 of the 2007 The Hartford annual report below. You can navigate through the pages in the report by either clicking on the pages listed below, or by using the keyword search tool below to find specific information within the annual report.-
 1
1 -
2
-
3
-
4
-
5
-
6
-
7
-
8
-
9
-
10
-
11
-
12
-
13
-
14
-
15
-
16
-
17
-
18
-
19
-
20
-
21
-
22
-
23
-
24
-
25
-
26
-
 27
27 -
 28
28 -
 29
29 -
 30
30 -
 31
31 -
 32
32 -
 33
33 -
 34
34 -
 35
35 -
 36
36 -
 37
37 -
 38
38 -
 39
39 -
 40
40 -
 41
41 -
 42
42 -
 43
43 -
 44
44 -
 45
45 -
 46
46 -
 47
47 -
48
-
49
-
50
-
51
-
52
-
53
-
54
-
55
-
56
-
57
-
58
-
59
-
60
-
61
-
62
-
63
-
64
-
65
-
66
-
67
-
68
-
69
-
70
-
71
-
72
-
73
-
74
-
75
-
76
-
77
-
78
-
79
-
80
-
81
-
82
-
83
-
84
-
85
-
86
-
87
-
88
-
89
-
90
-
91
-
92
-
93
-
94
-
95
-
96
-
97
-
98
-
99
-
100
-
101
-
102
-
103
-
104
-
105
-
106
-
107
-
108
-
109
-
110
-
111
-
112
-
113
-
114
-
115
-
116
-
117
-
118
-
119
-
120
-
121
-
122
-
123
-
124
-
125
-
126
-
127
-
128
-
129
-
130
-
131
-
132
-
133
-
134
-
135
-
136
-
137
-
138
-
139
-
140
-
141
-
142
-
143
-
144
-
145
-
146
-
147
-
148
-
149
-
150
-
151
-
152
-
153
-
154
-
155
-
156
-
157
-
158
-
159
-
160
-
161
-
162
-
163
-
164
-
165
-
166
-
167
-
168
-
169
-
170
-
171
-
172
-
173
-
174
-
175
-
176
-
177
-
178
-
179
-
180
-
181
-
182
-
183
-
184
-
185
-
186
-
187
-
188
-
189
-
190
-
191
-
192
-
193
-
194
-
195
-
196
-
197
-
198
-
199
-
200
-
201
-
202
-
203
-
204
-
205
-
206
-
207
-
208
-
209
-
210
-
211
-
212
-
213
-
214
-
215
-
216
-
217
-
218
-
219
-
220
-
221
-
222
-
223
-
224
-
225
-
226
-
227
-
228
-
229
-
230
-
231
-
232
-
233
-
234
-
235
-
236
-
237
-
238
-
239
-
240
-
241
-
242
-
243
-
244
-
245
-
246
-
247
-
248
-
249
-
250
-
251
-
252
-
253
-
254
-
255
-
256
-
257
-
258
-
259
-
260
-
261
-
262
-
263
-
264
-
265
-
266
-
267
-
268
-
269
-
270
-
271
-
272
-
273
-
274
-
275
-
276
 |
 |
37
development. Accordingly, for more recent accident periods, the Company generally relies more heavily on a state-by-state analysis and
the expected loss ratio approach.
Professional Liability. Reported and paid loss developments patterns for this line tend to be volatile. Therefore, the Company typically
relies on frequency and severity techniques.
Assumed Reinsurance and All Other within Other Operations. For these lines, management tends to rely on the reported development
techniques. In assumed reinsurance, assumptions are influenced by information gained from claim and underwriting audits.
Allocated Loss Adjustment Expenses (ALAE). For some lines of business (e.g., professional liability and assumed reinsurance), ALAE
and losses are analyzed together. For most lines of business, however, ALAE is analyzed separately, using paid development and
frequency / severity techniques.
Unallocated Loss Adjustment Expense (ULAE). ULAE is analyzed separately from loss and ALAE. For most lines of business,
incurred ULAE costs to be paid in the future are projected based on an expected cost per claim year and the anticipated claim closure
pattern and the ratio of paid ULAE to paid loss.
The final step in the reserve review process involves a comprehensive review by senior reserving actuaries who apply their judgment
and, in concert with senior management, determine the appropriate level of reserves based on the various information that has been
accumulated. Numerous factors are considered in this determination process including, but not limited to, the assessed reliability of key
loss trends and assumptions that may be significantly influencing the current actuarial indications, the maturity of the accident year,
pertinent trends observed over the recent past, the level of volatility within a particular line of business, and the improvement or
deterioration of actuarial indications in the current period as compared to the prior periods. In general, changes are made more quickly
to more mature accident years and less volatile lines of business. At year-end 2007, total recorded net reserves excluding asbestos and
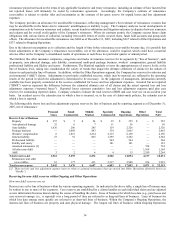
environmental and excluding the allowance for uncollectible reinsurance were 2.7% higher than the actuarial indication of the reserves.
Annually, as part of the statutory reporting requirements, IBNR is allocated to accident year by statutory line of business. This work
forms the basis for the loss development table and reserve re-estimates table shown in the "Business" section.
During 2007, there were numerous changes to non-A&E reserve estimates. Among other loss developments in 2007, these changes
included a $151 release of workers’ compensation reserves for accident years 2002 to 2006, a $49 release of general liability loss and loss
adjustment expense reserves for accident years 2003 to 2006 and a $79 strengthening of workers’ compensation and general liability
reserves for accident years more than 20 years old. See “Reserves” within the Property and Casualty MD&A for further discussion of
reserve developments.
Current trends contributing to reserve uncertainty
The Hartford is a multi-line company in the property and casualty business. The Hartford is therefore subject to reserve uncertainty
stemming from a number of conditions, including but not limited to those noted above, any of which could be material at any point in
time for any segment. Certain issues may become more or less important over time as conditions change. As various market conditions
develop, management must assess whether those conditions constitute a long-term trend that should result in a reserving action (i.e.,
increasing or decreasing the reserve).
Within the commercial segments and the Other Operations segment, the Company has exposure to claims asserted for bodily injury as a
result of long-term or continuous exposure to harmful products or substances. Examples include, but are not limited to, pharmaceutical
products, silica and lead paint. The Company also has exposure to claims from construction defects, where property damage or bodily
injury from negligent construction is alleged. The Company also has exposure to claims asserted against religious institutions and other
organizations relating to molestation or abuse. Such exposures may involve potentially long latency periods and may implicate
coverage in multiple policy periods. These factors make reserves for such claims more uncertain than other bodily injury or property
damage claims. With regard to these exposures, the Company is monitoring trends in litigation, the external environment, the
similarities to other mass torts and the potential impact on the Company’ s reserves.
In Personal Lines, reserving estimates are generally less variable than for the Company’ s other property and casualty segments. This is
largely due to the coverages having relatively shorter periods of loss emergence. Estimates, however, can still vary due to a number of
factors, including interpretations of frequency and severity trends and their impact on recorded reserve levels. Severity trends can be
impacted by changes in internal claim handling and case reserving practices in addition to changes in the external environment. These
changes in claim practices increase the uncertainty in the interpretation of case reserve data, which increases the uncertainty in recorded
reserve levels. In addition, the introduction of new products has lead to a different mix of business by type of insured than the Company
experienced in the past. Beginning in 2004, the Company introduced its Dimensions auto and homeowners product for Agency business
and beginning in 2007, the Company introduced its Next Generation Auto product for AARP customers. In general, the Company now
has a lower proportion of preferred risks than in the past. Such a change in mix increases the uncertainty of the reserve projections,
since historical data and reporting patterns may not be applicable to the new business.
In both Small Commercial and Middle Market, workers’ compensation is the Company’ s single biggest line of business and the line of
business with the longest pattern of loss emergence. Reserve estimates for workers’ compensation are particularly sensitive to
assumptions about medical inflation and the changing use of medical care procedures. In addition, changes in state legislative and
regulatory environments impact the Company’ s estimates. These changes increase the uncertainty in the application of development
patterns.