The Hartford 2007 Annual Report Download - page 102
Download and view the complete annual report
Please find page 102 of the 2007 The Hartford annual report below. You can navigate through the pages in the report by either clicking on the pages listed below, or by using the keyword search tool below to find specific information within the annual report.-
 1
1 -
2
-
3
-
4
-
5
-
6
-
7
-
8
-
9
-
10
-
11
-
12
-
13
-
14
-
15
-
16
-
17
-
18
-
19
-
20
-
21
-
22
-
23
-
24
-
25
-
26
-
27
-
28
-
29
-
30
-
31
-
32
-
33
-
34
-
35
-
36
-
37
-
38
-
39
-
40
-
41
-
42
-
43
-
44
-
45
-
46
-
47
-
48
-
49
-
50
-
51
-
52
-
53
-
54
-
55
-
56
-
57
-
58
-
59
-
60
-
61
-
62
-
63
-
64
-
65
-
66
-
67
-
68
-
69
-
70
-
71
-
72
-
73
-
74
-
75
-
76
-
77
-
78
-
79
-
80
-
81
-
82
-
83
-
84
-
85
-
86
-
87
-
88
-
89
-
90
-
91
-
 92
92 -
 93
93 -
 94
94 -
 95
95 -
 96
96 -
 97
97 -
 98
98 -
 99
99 -
 100
100 -
 101
101 -
 102
102 -
 103
103 -
 104
104 -
 105
105 -
 106
106 -
 107
107 -
 108
108 -
 109
109 -
 110
110 -
 111
111 -
 112
112 -
113
-
114
-
115
-
116
-
117
-
118
-
119
-
120
-
121
-
122
-
123
-
124
-
125
-
126
-
127
-
128
-
129
-
130
-
131
-
132
-
133
-
134
-
135
-
136
-
137
-
138
-
139
-
140
-
141
-
142
-
143
-
144
-
145
-
146
-
147
-
148
-
149
-
150
-
151
-
152
-
153
-
154
-
155
-
156
-
157
-
158
-
159
-
160
-
161
-
162
-
163
-
164
-
165
-
166
-
167
-
168
-
169
-
170
-
171
-
172
-
173
-
174
-
175
-
176
-
177
-
178
-
179
-
180
-
181
-
182
-
183
-
184
-
185
-
186
-
187
-
188
-
189
-
190
-
191
-
192
-
193
-
194
-
195
-
196
-
197
-
198
-
199
-
200
-
201
-
202
-
203
-
204
-
205
-
206
-
207
-
208
-
209
-
210
-
211
-
212
-
213
-
214
-
215
-
216
-
217
-
218
-
219
-
220
-
221
-
222
-
223
-
224
-
225
-
226
-
227
-
228
-
229
-
230
-
231
-
232
-
233
-
234
-
235
-
236
-
237
-
238
-
239
-
240
-
241
-
242
-
243
-
244
-
245
-
246
-
247
-
248
-
249
-
250
-
251
-
252
-
253
-
254
-
255
-
256
-
257
-
258
-
259
-
260
-
261
-
262
-
263
-
264
-
265
-
266
-
267
-
268
-
269
-
270
-
271
-
272
-
273
-
274
-
275
-
276
 |
 |

102
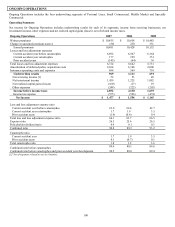
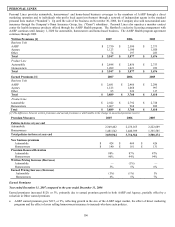
Personal
Lines
Excluding the effect of Omni, the 3.3 point increase in the current accident year loss and loss adjustment
expense ratio before catastrophes in Personal Lines was primarily due to increased severity on auto
liability claims, increased frequency on auto property damage claims and, to a lesser extent, increased
severity on homeowners claims, partially offset by the effect of earned pricing increases in homeowners.
Small
Commercial
The 1.4 point increase in the current accident year loss and loss adjustment expense ratio before
catastrophes in Small Commercial was primarily due to a higher loss ratio and loss adjustment expense
ratio for package business and commercial auto claims, partially offset by a lower loss and loss
adjustment expense ratio for workers’ compensation claims.
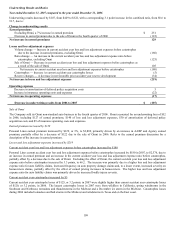
Middle
Market
The 2.2 point increase in the current accident year loss and loss adjustment expense ratio before
catastrophes in Middle Market was primarily due to a higher loss and loss adjustment expense ratio for
workers’ compensation, general liability and commercial auto claims driven, in part, by earned pricing
decreases. For commercial auto, loss costs increased for both liability and property damage claims.
Specialty
Commercial
The 2.2 point decrease in the current accident year loss and loss adjustment expense ratio before
catastrophes in Specialty Commercial was primarily due to a lower loss and loss adjustment ratio on
directors and officers insurance in professional liability, partially offset by a higher loss and loss
adjustment expense ratio on casualty business.
Current accident year catastrophes decreased by $22
Current accident year catastrophe losses decreased by $22, from $199, or 1.9 points, in 2006 to $177, or 1.7 points, in 2007. The largest
catastrophe losses in 2007 were from wildfires in California, spring windstorms in the Southeast and Northeast, tornadoes and
thunderstorms in the Midwest and a December ice storm in the Midwest. Catastrophes in 2006 included tornadoes and hail storms in the
Midwest and windstorms in Texas and on the East coast.
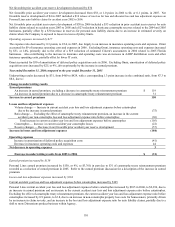
Increase in net favorable prior accident year reserve development by $81
Net favorable prior accident year reserve development increased from $64, or 0.6 points, in 2006 to $145, or 1.4 points, in 2007. Net
favorable reserve development of $145 in 2007 included several changes in reserves, including a $151 release of workers’ compensation
loss and loss adjustment expense reserves, primarily for accident years 2002 to 2006. Refer to the “Reserves” section of the MD&A for
further discussion of the prior accident year reserve development in 2007.
The $64 of net favorable prior accident year development in 2006 included several changes in reserves, including an $83 net release of
prior accident year hurricane reserves. Refer to the “Reserves” section of the MD&A for further discussion of the prior accident year
reserve development in 2006.
Operating expenses increased by $123
The 0.7 point increase in the expense ratio and the 0.3 point increase in the policyholder dividend ratio was primarily due to an increase
in insurance operating costs and expenses. Insurance operating costs and expenses increased by $125, partly because insurance
operating costs and expenses in 2006 included the effect of a $41 reduction of estimated Citizens’ assessments related to the 2005
Florida hurricanes. Also contributing to the increase in insurance and operating costs and expenses was a $34 increase in policyholder
dividends due largely to a $20 increase in the estimated amount of dividends payable to certain workers’ compensation policyholders
due to underwriting profits. Apart from the effect of Citizens assessments and policyholder dividends, insurance operating costs and
expenses increased by $50, primarily due to an increase in IT costs and an increase in non-deferrable salaries and benefits and other
internal operating costs.
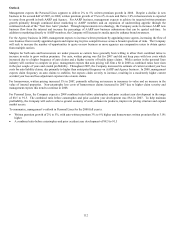
Despite the increase in earned premium, amortization of deferred policy acquisition costs remained relatively flat from 2006 to 2007 due
to the effect of the sale of Omni. Excluding the effect of Omni, amortization increased by $28, or 1%, primarily driven by the 2%
growth in earned premiums excluding Omni. In 2006, Omni accounted for $127 of earned premiums and $30 of amortization.
Net investment income increased by $214
Primarily driving the $214 increase in net investment income was a higher average invested asset base and income earned from a higher
portfolio yield. The increase in the average invested asset base contributing to the increase in investment income was primarily due to
positive operating cash flows, partially offset by the return of capital to Corporate. Contributing to the increase in net investment
income was an increase in income from limited partnerships and other alternative investments, driven by a higher yield on these
investments and shifting a greater allocation of investments to these asset classes.
Net realized capital losses increased by $143
Net realized capital losses increased from $17 in 2006 to $160 in 2007, primarily due to an increase in credit-related impairments and
decreases in the fair value of non-qualifying derivatives attributable to changes in value associated with credit derivatives due to credit
spreads widening. Credit-related impairments in 2007 primarily consisted of impairments of asset-backed securities backed by sub-
prime residential mortgage loans and impairments of corporate securities in the financial services and homebuilders sectors. (See the
Other-Than-Temporary Impairments discussion within Investment Results for more information on the impairments recorded in 2007).