The Hartford 2007 Annual Report Download - page 210
Download and view the complete annual report
Please find page 210 of the 2007 The Hartford annual report below. You can navigate through the pages in the report by either clicking on the pages listed below, or by using the keyword search tool below to find specific information within the annual report.-
 1
1 -
2
-
3
-
4
-
5
-
6
-
7
-
8
-
9
-
10
-
11
-
12
-
13
-
14
-
15
-
16
-
17
-
18
-
19
-
20
-
21
-
22
-
23
-
24
-
25
-
26
-
27
-
28
-
29
-
30
-
31
-
32
-
33
-
34
-
35
-
36
-
37
-
38
-
39
-
40
-
41
-
42
-
43
-
44
-
45
-
46
-
47
-
48
-
49
-
50
-
51
-
52
-
53
-
54
-
55
-
56
-
57
-
58
-
59
-
60
-
61
-
62
-
63
-
64
-
65
-
66
-
67
-
68
-
69
-
70
-
71
-
72
-
73
-
74
-
75
-
76
-
77
-
78
-
79
-
80
-
81
-
82
-
83
-
84
-
85
-
86
-
87
-
88
-
89
-
90
-
91
-
92
-
93
-
94
-
95
-
96
-
97
-
98
-
99
-
100
-
101
-
102
-
103
-
104
-
105
-
106
-
107
-
108
-
109
-
110
-
111
-
112
-
113
-
114
-
115
-
116
-
117
-
118
-
119
-
120
-
121
-
122
-
123
-
124
-
125
-
126
-
127
-
128
-
129
-
130
-
131
-
132
-
133
-
134
-
135
-
136
-
137
-
138
-
139
-
140
-
141
-
142
-
143
-
144
-
145
-
146
-
147
-
148
-
149
-
150
-
151
-
152
-
153
-
154
-
155
-
156
-
157
-
158
-
159
-
160
-
161
-
162
-
163
-
164
-
165
-
166
-
167
-
168
-
169
-
170
-
171
-
172
-
173
-
174
-
175
-
176
-
177
-
178
-
179
-
180
-
181
-
182
-
183
-
184
-
185
-
186
-
187
-
188
-
189
-
190
-
191
-
192
-
193
-
194
-
195
-
196
-
197
-
198
-
199
-
 200
200 -
 201
201 -
 202
202 -
 203
203 -
 204
204 -
 205
205 -
 206
206 -
 207
207 -
 208
208 -
 209
209 -
 210
210 -
 211
211 -
 212
212 -
 213
213 -
 214
214 -
 215
215 -
 216
216 -
 217
217 -
 218
218 -
 219
219 -
 220
220 -
221
-
222
-
223
-
224
-
225
-
226
-
227
-
228
-
229
-
230
-
231
-
232
-
233
-
234
-
235
-
236
-
237
-
238
-
239
-
240
-
241
-
242
-
243
-
244
-
245
-
246
-
247
-
248
-
249
-
250
-
251
-
252
-
253
-
254
-
255
-
256
-
257
-
258
-
259
-
260
-
261
-
262
-
263
-
264
-
265
-
266
-
267
-
268
-
269
-
270
-
271
-
272
-
273
-
274
-
275
-
276
 |
 |

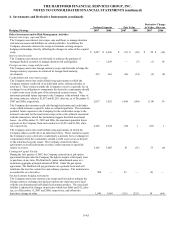
THE HARTFORD FINANCIAL SERVICES GROUP, INC.
NOTES TO CONSOLIDATED FINANCIAL STATEMENTS (continued)
F-33
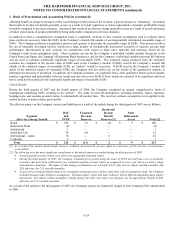
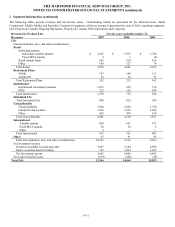
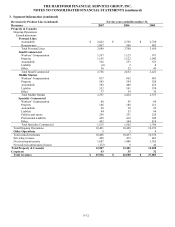
3. Segment Information (continued)
For the years ended December 31,
Net Income (Loss) 2007 2006 2005
Life
Retail $ 812 $ 536 $ 595
Retirement Plans 61 101 82
Institutional 17 78 115
Individual Life 182 150 173
Group Benefits 315 298 266
International 223 231 75
Other [1] (52) 47 (102)
Total Life 1,558 1,441 1,204
Property & Casualty
Ongoing Operations
Underwriting Results
Personal Lines 322 429 460
Small Commercial 508 422 232
Middle Market 144 207 163
Specialty Commercial (5) 53 (164)
Total Ongoing Operations underwriting results 969 1,111 691
Net servicing and other income [2] 52 53 49
Net investment income 1,439 1,225 1,082
Net realized capital (losses) gains (160) (17) 19
Other expenses (248) (222) (202)
Income tax expense (575) (596) (474)
Ongoing Operations 1,477 1,554 1,165
Other Operations 30 (35) 71
Total Property & Casualty 1,507 1,519 1,236
Corporate (116) (215) (166)
Net income $2,949 $ 2,745 $2,274
[1] Amount for the year ended December 31, 2005, reflects an after-tax charge of $102 to reserve for investigations related to market timing by the
SEC and New York Attorney General’s Office, directed brokerage by the SEC and single premium group annuities by the New York Attorney
General’s Office and the Connecticut Attorney General’s Office.
[2] Amount is net of expenses related to service business.
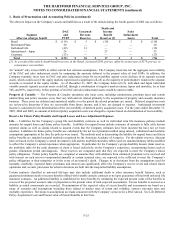
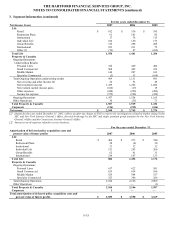
For the years ended December 31,
Amortization of deferred policy acquisition costs and
present value of future profits 2007 2006 2005
Life
Retail $ 406 $ 973 $ 740
Retirement Plans 58 (4) 30
Institutional 23 32 32
Individual Life 121 243 206
Group Benefits 62 41 31
International 214 167 133
Total Life 884 1,452 1,172
Property & Casualty
Ongoing Operations
Personal Lines 617 622 581
Small Commercial 635 634 596
Middle Market 529 544 537
Specialty Commercial 323 306 286
Total Ongoing Operations 2,104 2,106 2,000
Other Operations — — (3)
Total Property & Casualty 2,104 2,106 1,997
Corporate 1 — —
Total amortization of deferred policy acquisition costs and
present value of future profits $2,989 $3,558 $3,169