The Hartford 2007 Annual Report Download - page 255
Download and view the complete annual report
Please find page 255 of the 2007 The Hartford annual report below. You can navigate through the pages in the report by either clicking on the pages listed below, or by using the keyword search tool below to find specific information within the annual report.-
 1
1 -
2
-
3
-
4
-
5
-
6
-
7
-
8
-
9
-
10
-
11
-
12
-
13
-
14
-
15
-
16
-
17
-
18
-
19
-
20
-
21
-
22
-
23
-
24
-
25
-
26
-
27
-
28
-
29
-
30
-
31
-
32
-
33
-
34
-
35
-
36
-
37
-
38
-
39
-
40
-
41
-
42
-
43
-
44
-
45
-
46
-
47
-
48
-
49
-
50
-
51
-
52
-
53
-
54
-
55
-
56
-
57
-
58
-
59
-
60
-
61
-
62
-
63
-
64
-
65
-
66
-
67
-
68
-
69
-
70
-
71
-
72
-
73
-
74
-
75
-
76
-
77
-
78
-
79
-
80
-
81
-
82
-
83
-
84
-
85
-
86
-
87
-
88
-
89
-
90
-
91
-
92
-
93
-
94
-
95
-
96
-
97
-
98
-
99
-
100
-
101
-
102
-
103
-
104
-
105
-
106
-
107
-
108
-
109
-
110
-
111
-
112
-
113
-
114
-
115
-
116
-
117
-
118
-
119
-
120
-
121
-
122
-
123
-
124
-
125
-
126
-
127
-
128
-
129
-
130
-
131
-
132
-
133
-
134
-
135
-
136
-
137
-
138
-
139
-
140
-
141
-
142
-
143
-
144
-
145
-
146
-
147
-
148
-
149
-
150
-
151
-
152
-
153
-
154
-
155
-
156
-
157
-
158
-
159
-
160
-
161
-
162
-
163
-
164
-
165
-
166
-
167
-
168
-
169
-
170
-
171
-
172
-
173
-
174
-
175
-
176
-
177
-
178
-
179
-
180
-
181
-
182
-
183
-
184
-
185
-
186
-
187
-
188
-
189
-
190
-
191
-
192
-
193
-
194
-
195
-
196
-
197
-
198
-
199
-
200
-
201
-
202
-
203
-
204
-
205
-
206
-
207
-
208
-
209
-
210
-
211
-
212
-
213
-
214
-
215
-
216
-
217
-
218
-
219
-
220
-
221
-
222
-
223
-
224
-
225
-
226
-
227
-
228
-
229
-
230
-
231
-
232
-
233
-
234
-
235
-
236
-
237
-
238
-
239
-
240
-
241
-
242
-
243
-
244
-
 245
245 -
 246
246 -
 247
247 -
 248
248 -
 249
249 -
 250
250 -
 251
251 -
 252
252 -
 253
253 -
 254
254 -
 255
255 -
 256
256 -
 257
257 -
 258
258 -
 259
259 -
 260
260 -
 261
261 -
 262
262 -
 263
263 -
 264
264 -
 265
265 -
266
-
267
-
268
-
269
-
270
-
271
-
272
-
273
-
274
-
275
-
276
 |
 |

THE HARTFORD FINANCIAL SERVICES GROUP, INC.
NOTES TO CONSOLIDATED FINANCIAL STATEMENTS (continued)
F-78
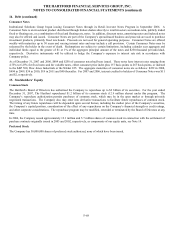
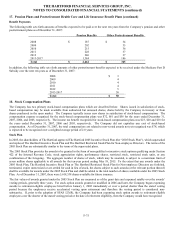
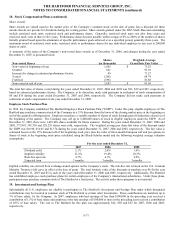
20. Sale of Subsidiary
On November 30, 2006, the Company sold its non-standard auto insurance business, Omni Insurance Group, Inc. (“Omni”). Under the
terms the agreement, the Company continues to be obligated for certain extra contractual liability claims and for claims and expenses
arising from all business written by Omni in the states of California and New York. The Company has since taken action to cease
writing new non-standard business in both California and New York. The Company believes that exiting the traditional non-standard
auto insurance business will streamline its operations and help the Company align its resources towards achieving core business
objectives.
The total consideration for the sale of approximately $104 included a cash dividend prior to the sale of $38 and a purchase price of $65,
of which $60 was received in cash at closing and $5 was received in 2007. In 2006, the Company recorded an after-tax gain from the
sale of $25, which included an income tax benefit of $49 and a pre-tax loss of $24. The pre-tax loss is recorded within realized gains
and losses in the 2006 consolidated statement of operations. The $49 income tax benefit arose because the tax basis of the Company's
investment in Omni exceeded the financial statement carrying value. The assets that were sold at the closing date included $172 of
cash, $8 of invested assets, $31 of premiums receivable, $3 of Personal Lines segment goodwill allocated to the Omni business and $23
of other assets. The liabilities sold at the closing date included $111 of loss and loss adjustment expense reserves, $37 of unearned
premium and $14 of other liabilities.
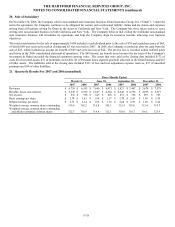
21. Quarterly Results For 2007 and 2006 (unaudited)
Three Months Ended
March 31, June 30, September 30, December 31,
2007 2006 2007 2006 2007 2006 2007 2006
Revenues $ 6,759 $6,543 $7,660 $4,971 $5,823 $ 7,407 $ 5,674 $7,579
Benefits, losses and expenses $ 5,547 $5,559 $6,823 $4,366 $4,648 $ 6,396 $ 4,893 $6,577
Net income $ 876 $ 728 $ 627 $ 476 $ 851 $ 758 $ 595 $ 783
Basic earnings per share $ 2.74 $2.41 $1.98 $1.57 $2.70 $ 2.45 $ 1.90 $2.45
Diluted earnings per share $ 2.71 $2.34 $1.96 $1.52 $2.68 $ 2.39 $ 1.88 $2.42
Weighted average common shares outstanding 319.6 302.2 316.8 303.3 315.4 310.0 313.4 319.7
Weighted average common shares outstanding
and dilutive potential common shares 322.7 310.9 319.6 312.3 318.0 316.7 316.1 323.9