The Hartford 2007 Annual Report Download - page 61
Download and view the complete annual report
Please find page 61 of the 2007 The Hartford annual report below. You can navigate through the pages in the report by either clicking on the pages listed below, or by using the keyword search tool below to find specific information within the annual report.
61
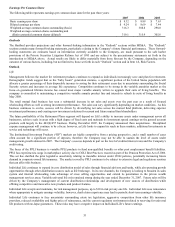
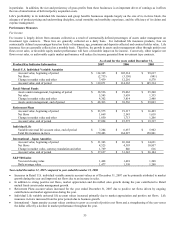
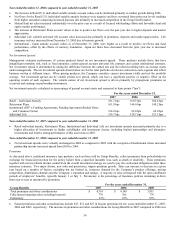
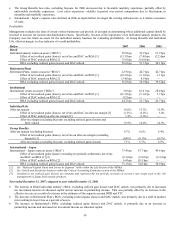
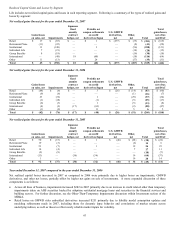
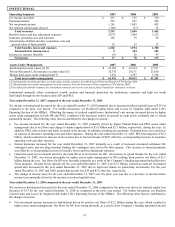
Realized Capital Gains and Losses by Segment
Life includes net realized capital gains and losses in each reporting segment. Following is a summary of the types of realized gains and
losses by segment:
Net realized gains (losses) for the year ended December 31, 2007
Gains/losses
on sales, net Impairments
Japanese
fixed
annuity
contract
hedges, net
Periodic net
coupon settlements
on credit
derivatives/Japan
U.S. GMWB
derivatives,
net
Other,
net Total
Total
gains/losses,
net of tax
and DAC
Retail $ 17 $ (87) $ — $ 1 $ (277) $ (35) $ (381) $ (169)
Retirement Plans (11) (22) — — — (8) (41) (28)
Institutional 13 (148) — 3 — (56) (188) (121)
Individual Life 7 (21) — — — (14) (28) (15)
Group Benefits 8 (19) — — — (19) (30) (18)
International — (48) 18 (68) — (18) (116) (64)
Other 11 (13) — 24 — (57) (35) (31)
Total $ 45 $ (358) $ 18 $ (40) $ (277) $ (207) $ (819) $ (446)
Net realized gains (losses) for the year ended December 31, 2006
Gains/losses
on sales, net Impairments
Japanese
fixed
annuity
contract
hedges, net
Periodic net
coupon settlements
on credit
derivatives/Japan
U.S. GMWB
derivatives,
net
Other,
net Total
Total
gains/losses,
net of tax
and DAC
Retail $ (44) $ (6) $ — $ 3 $ (26) $ (14) $ (87) $ (90)
Retirement Plans (9) (6) — — — (1) (16) (7)
Institutional 23 (32) — 1 — (29) (37) (24)
Individual Life (1) (18) — (1) — (5) (25) (17)
Group Benefits (6) (3) — 1 — (5) (13) (8)
International (4) (2) (17) (63) — (2)
(88) (47)
Other (1) (9) — 11 — 5 6 5
Total $ (42) $ (76) $ (17) $ (48) $ (26) $ (51) $ (260) $ (188)
Net realized gains (losses) for the year ended December 31, 2005
Gains/losses
on sales, net Impairments
Japanese
fixed
annuity
contract
hedges, net
Periodic net
coupon settlements
on credit
derivatives/Japan
U.S. GMWB
derivatives,
net
Other,
net Total
Total
gains/losses,
net of tax
and DAC
Retail $ 50 $ (15) $ — $ 1 $ (46) $ (28) $ (38) $ (24)
Retirement Plans 19 (3) — — — (2) 14 6
Institutional 23 (7) — 1 — 19 36 23
Individual Life 14 (4) — — — 7 17 11
Group Benefits (2) (8) — — — — (10) (7)
International (13) — (36) (34) — 19 (64) (37)
Other 1 — — — — 19 20 14
Total $ 92 $ (37) $ (36) $ (32) $ (46) $ 34 $ (25) $ (14)
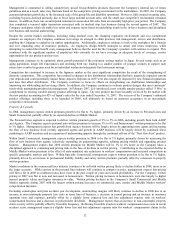
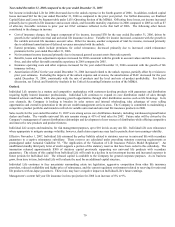
Year ended December 31, 2007 compared to the year ended December 31, 2006
Net realized capital losses increased in 2007 as compared to 2006 were primarily due to higher losses on impairments, GMWB
derivatives, and other net losses, partially offset by higher net gains on sale of investments. A more expanded discussion of these
components is as follows:
• Across all lines of business, impairments increased $282 in 2007 primarily due to an increase in credit related other than temporary
impairments taken on ABS securities backed by subprime residential mortgage loans and securities in the financial services and
building sectors. For further discussion, see the Other-Than-Temporary Impairments discussion within Investment section of the
MD&A.
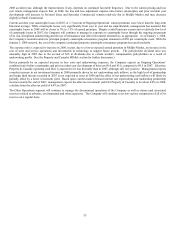
• Retail losses on GMWB rider embedded derivatives increased $251 primarily due to liability model assumption updates and
modeling refinements made in 2007, including those for dynamic lapse behavior and correlations of market returns across
underlying indices, as well as those to reflect newly reliable market inputs for volatility.


