The Hartford 2007 Annual Report Download - page 48
Download and view the complete annual report
Please find page 48 of the 2007 The Hartford annual report below. You can navigate through the pages in the report by either clicking on the pages listed below, or by using the keyword search tool below to find specific information within the annual report.-
 1
1 -
2
-
3
-
4
-
5
-
6
-
7
-
8
-
9
-
10
-
11
-
12
-
13
-
14
-
15
-
16
-
17
-
18
-
19
-
20
-
21
-
22
-
23
-
24
-
25
-
26
-
27
-
28
-
29
-
30
-
31
-
32
-
33
-
34
-
35
-
36
-
37
-
 38
38 -
 39
39 -
 40
40 -
 41
41 -
 42
42 -
 43
43 -
 44
44 -
 45
45 -
 46
46 -
 47
47 -
 48
48 -
 49
49 -
 50
50 -
 51
51 -
 52
52 -
 53
53 -
 54
54 -
 55
55 -
 56
56 -
 57
57 -
 58
58 -
59
-
60
-
61
-
62
-
63
-
64
-
65
-
66
-
67
-
68
-
69
-
70
-
71
-
72
-
73
-
74
-
75
-
76
-
77
-
78
-
79
-
80
-
81
-
82
-
83
-
84
-
85
-
86
-
87
-
88
-
89
-
90
-
91
-
92
-
93
-
94
-
95
-
96
-
97
-
98
-
99
-
100
-
101
-
102
-
103
-
104
-
105
-
106
-
107
-
108
-
109
-
110
-
111
-
112
-
113
-
114
-
115
-
116
-
117
-
118
-
119
-
120
-
121
-
122
-
123
-
124
-
125
-
126
-
127
-
128
-
129
-
130
-
131
-
132
-
133
-
134
-
135
-
136
-
137
-
138
-
139
-
140
-
141
-
142
-
143
-
144
-
145
-
146
-
147
-
148
-
149
-
150
-
151
-
152
-
153
-
154
-
155
-
156
-
157
-
158
-
159
-
160
-
161
-
162
-
163
-
164
-
165
-
166
-
167
-
168
-
169
-
170
-
171
-
172
-
173
-
174
-
175
-
176
-
177
-
178
-
179
-
180
-
181
-
182
-
183
-
184
-
185
-
186
-
187
-
188
-
189
-
190
-
191
-
192
-
193
-
194
-
195
-
196
-
197
-
198
-
199
-
200
-
201
-
202
-
203
-
204
-
205
-
206
-
207
-
208
-
209
-
210
-
211
-
212
-
213
-
214
-
215
-
216
-
217
-
218
-
219
-
220
-
221
-
222
-
223
-
224
-
225
-
226
-
227
-
228
-
229
-
230
-
231
-
232
-
233
-
234
-
235
-
236
-
237
-
238
-
239
-
240
-
241
-
242
-
243
-
244
-
245
-
246
-
247
-
248
-
249
-
250
-
251
-
252
-
253
-
254
-
255
-
256
-
257
-
258
-
259
-
260
-
261
-
262
-
263
-
264
-
265
-
266
-
267
-
268
-
269
-
270
-
271
-
272
-
273
-
274
-
275
-
276
 |
 |

48
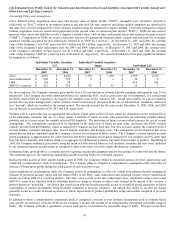
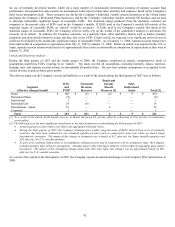
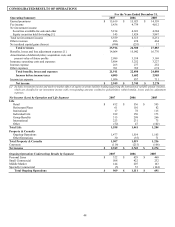
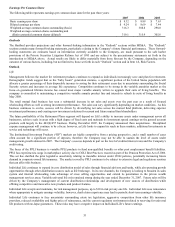
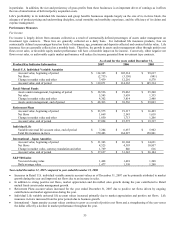
CONSOLIDATED RESULTS OF OPERATIONS
For the Years Ended December 31,
Operating Summary 2007 2006 2005
Earned premiums $ 15,619 $ 15,023 $ 14,359
Fee income 5,436 4,739 4,012
Net investment income
Securities available-for-sale and other 5,214 4,691 4,384
Equity securities held for trading [1] 145 1,824 3,847
Total net investment income 5,359 6,515 8,231
Other revenues 496 474 464
Net realized capital gains (losses) (994) (251) 17
Total revenues 25,916 26,500 27,083
Benefits, losses and loss adjustment expenses [1] 14,064 15,042 16,776
Amortization of deferred policy acquisition costs and
present value of future profits
2,989
3,558
3,169
Insurance operating costs and expenses 3,894 3,252 3,227
Interest expense 263 277 252
Other expenses 701 769 674
Total benefits, losses and expenses 21,911 22,898 24,098
Income before income taxes 4,005 3,602 2,985
Income tax expense 1,056 857 711
Net income $ 2,949 $ 2,745 $2,274
[1] Includes investment income and mark-to-market effects of equity securities held for trading supporting the international variable annuity business,
which are classified in net investment income with corresponding amounts credited to policyholders within benefits, losses and loss adjustment
expenses.
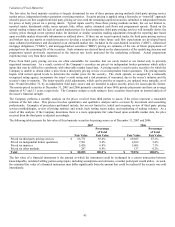
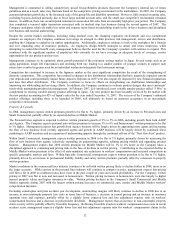
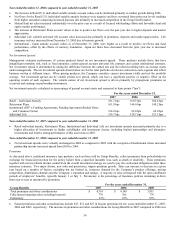
Net Income (Loss) by Operation and Life Segment 2007 2006 2005
Life
Retail $ 812 $ 536 $ 595
Retirement Plans 61 101 82
Institutional 17 78 115
Individual Life 182 150 173
Group Benefits 315 298 266
International 223 231 75
Other (52) 47 (102)
Total Life 1,558 1,441 1,204
Property & Casualty
Ongoing Operations 1,477 1,554 1,165
Other Operations 30 (35) 71
Total Property & Casualty 1,507 1,519 1,236
Corporate (116) (215) (166)
Net income $ 2,949 $ 2,745 $ 2,274
Ongoing Operations Underwriting Results by Segment 2007 2006 2005
Personal Lines $ 322 $ 429 $ 460
Small Commercial 508 422 232
Middle Market 144 207 163
Specialty Commercial (5) 53 (164)
Total Ongoing Operations $ 969 $ 1,111 $ 691