The Hartford 2007 Annual Report Download - page 222
Download and view the complete annual report
Please find page 222 of the 2007 The Hartford annual report below. You can navigate through the pages in the report by either clicking on the pages listed below, or by using the keyword search tool below to find specific information within the annual report.-
 1
1 -
2
-
3
-
4
-
5
-
6
-
7
-
8
-
9
-
10
-
11
-
12
-
13
-
14
-
15
-
16
-
17
-
18
-
19
-
20
-
21
-
22
-
23
-
24
-
25
-
26
-
27
-
28
-
29
-
30
-
31
-
32
-
33
-
34
-
35
-
36
-
37
-
38
-
39
-
40
-
41
-
42
-
43
-
44
-
45
-
46
-
47
-
48
-
49
-
50
-
51
-
52
-
53
-
54
-
55
-
56
-
57
-
58
-
59
-
60
-
61
-
62
-
63
-
64
-
65
-
66
-
67
-
68
-
69
-
70
-
71
-
72
-
73
-
74
-
75
-
76
-
77
-
78
-
79
-
80
-
81
-
82
-
83
-
84
-
85
-
86
-
87
-
88
-
89
-
90
-
91
-
92
-
93
-
94
-
95
-
96
-
97
-
98
-
99
-
100
-
101
-
102
-
103
-
104
-
105
-
106
-
107
-
108
-
109
-
110
-
111
-
112
-
113
-
114
-
115
-
116
-
117
-
118
-
119
-
120
-
121
-
122
-
123
-
124
-
125
-
126
-
127
-
128
-
129
-
130
-
131
-
132
-
133
-
134
-
135
-
136
-
137
-
138
-
139
-
140
-
141
-
142
-
143
-
144
-
145
-
146
-
147
-
148
-
149
-
150
-
151
-
152
-
153
-
154
-
155
-
156
-
157
-
158
-
159
-
160
-
161
-
162
-
163
-
164
-
165
-
166
-
167
-
168
-
169
-
170
-
171
-
172
-
173
-
174
-
175
-
176
-
177
-
178
-
179
-
180
-
181
-
182
-
183
-
184
-
185
-
186
-
187
-
188
-
189
-
190
-
191
-
192
-
193
-
194
-
195
-
196
-
197
-
198
-
199
-
200
-
201
-
202
-
203
-
204
-
205
-
206
-
207
-
208
-
209
-
210
-
211
-
 212
212 -
 213
213 -
 214
214 -
 215
215 -
 216
216 -
 217
217 -
 218
218 -
 219
219 -
 220
220 -
 221
221 -
 222
222 -
 223
223 -
 224
224 -
 225
225 -
 226
226 -
 227
227 -
 228
228 -
 229
229 -
 230
230 -
 231
231 -
 232
232 -
233
-
234
-
235
-
236
-
237
-
238
-
239
-
240
-
241
-
242
-
243
-
244
-
245
-
246
-
247
-
248
-
249
-
250
-
251
-
252
-
253
-
254
-
255
-
256
-
257
-
258
-
259
-
260
-
261
-
262
-
263
-
264
-
265
-
266
-
267
-
268
-
269
-
270
-
271
-
272
-
273
-
274
-
275
-
276
 |
 |
THE HARTFORD FINANCIAL SERVICES GROUP, INC.
NOTES TO CONSOLIDATED FINANCIAL STATEMENTS (continued)
F-45
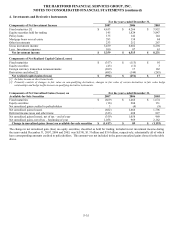
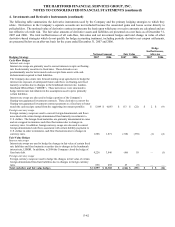
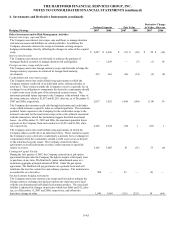
4. Investments and Derivative Instruments (continued)
The increase in notional of GMWB embedded derivatives is primarily due to additional product sales. The increase in notional of
GMWB hedging derivatives primarily related to two customized swap contracts that were entered into during 2007 to hedge certain
risk components for the remaining term of certain blocks of non-reinsured GMWB riders. These customized derivative contracts
provide protection from capital markets risks based on policyholder behavior assumptions as specified by the Company. As of
December 31, 2007, these swaps had a notional value of $12.8 billion and a market value of $50. Due to the significance of the non-
observable inputs associated with pricing these derivatives, the initial difference between the transaction price and modeled value was
deferred in accordance with EITF No. 02-3 “Issues Involved in Accounting for Derivative Contracts Held for Trading Purposes and
Contracts Involved in Energy Trading and Risk Management Activities” and included in other assets in the Consolidated Balance
Sheets. The deferred loss of $51 will be recognized in retained earnings upon the adoption of SFAS 157. In addition, the change in
value of the customized derivatives due to the initial adoption of SFAS 157 of $35 will also be recorded in retained earnings with
subsequent changes in fair value recorded in net realized capital gains (losses).
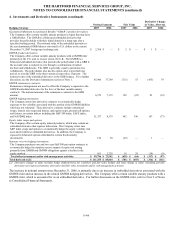
The decrease in net fair value of derivative instruments since December 31, 2006, was primarily related to the GMWB related
derivatives as well as credit derivatives, partially offset by the Japanese fixed annuity hedging instruments, interest rate derivatives, and
foreign currency swaps. The GMWB related derivatives decreased in value primarily due to liability model assumption updates and
modeling refinements made during the year, including those for dynamic lapse behavior and correlations of market returns across
underlying indices, as well as those to reflect newly reliable market inputs for volatility. Credit derivatives, including credit default
swaps and credit index swaps, declined in value due to credit spreads widening. Credit spreads widened primarily due to the
deterioration in the U.S. housing market, tightened lending conditions, the market’ s flight to quality securities, as well as increased
likelihood of a U.S. recession. The Japanese fixed annuity contract hedging instruments increased in value primarily due to
appreciation of the Japanese yen in comparison to the U.S. dollar. Interest rate derivatives increased in value primarily due to the
decline in interest rates. The fair value of foreign currency swaps hedging foreign bonds increased primarily as a result of the sale of
certain swaps that were in loss positions due to the weakening of the U.S. dollar in comparison to certain foreign currencies.
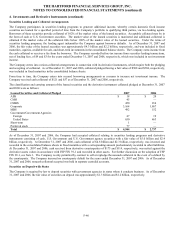
The total change in value for derivative-based strategies that do not qualify for hedge accounting treatment (“non-qualifying
strategies”), including periodic derivative net coupon settlements, are reported in net realized capital gains (losses). These non-
qualifying strategies resulted in after-tax net losses of $(317) and $(97), respectively, for the years ended December 31, 2007 and 2006.
For the year ended December 31, 2007, net losses were primarily comprised of net losses on GMWB related derivatives and net losses
on credit derivatives. The net losses on GMWB rider embedded derivatives were primarily due to liability model assumption updates
and modeling refinements made during the year, including those for dynamic lapse behavior and correlations of market returns across
underlying indices, as well as other assumption updates made during the second quarter to reflect newly reliable market inputs for
volatility. The net losses on credit derivatives, including credit default swaps, credit index swaps, and total return swaps, were due to
credit spreads widening. For the year ended December 31, 2006, net realized capital losses were primarily driven by losses on the
Japanese fixed annuity hedging instruments and interest rate swaps used to manage portfolio duration primarily due to rising interest
rates as well as losses on GMWB related derivatives primarily driven by liability model refinements and assumption updates reflecting
in-force demographics, actuarial experience, and future expectations.
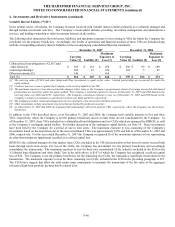
As of December 31, 2007 and 2006, the after-tax deferred net gains (losses) on derivative instruments recorded in AOCI that are
expected to be reclassified to earnings during the next twelve months are $(16) and $(7), respectively. This expectation is based on the
anticipated interest payments on hedged investments in fixed maturity securities that will occur over the next twelve months, at which
time the Company will recognize the deferred net gains (losses) as an adjustment to interest income over the term of the investment
cash flows. The maximum term over which the Company is hedging its exposure to the variability of future cash flows (for all
forecasted transactions, excluding interest payments on existing variable-rate financial instruments) is twenty-four months. For the
years ended December 31, 2007, 2006 and 2005, the Company had no net reclassifications from AOCI to earnings resulting from the
discontinuance of cash-flow hedges due to forecasted transactions that were no longer probable of occurring.
For the year ended December 31, 2005, after-tax net gains (losses) representing the total ineffectiveness of all cash-flow hedges was
$(7) and fair-value hedges was $2, while there were no net gains (losses) on net investment hedges.