The Hartford 2007 Annual Report Download - page 68
Download and view the complete annual report
Please find page 68 of the 2007 The Hartford annual report below. You can navigate through the pages in the report by either clicking on the pages listed below, or by using the keyword search tool below to find specific information within the annual report.-
 1
1 -
2
-
3
-
4
-
5
-
6
-
7
-
8
-
9
-
10
-
11
-
12
-
13
-
14
-
15
-
16
-
17
-
18
-
19
-
20
-
21
-
22
-
23
-
24
-
25
-
26
-
27
-
28
-
29
-
30
-
31
-
32
-
33
-
34
-
35
-
36
-
37
-
38
-
39
-
40
-
41
-
42
-
43
-
44
-
45
-
46
-
47
-
48
-
49
-
50
-
51
-
52
-
53
-
54
-
55
-
56
-
57
-
 58
58 -
 59
59 -
 60
60 -
 61
61 -
 62
62 -
 63
63 -
 64
64 -
 65
65 -
 66
66 -
 67
67 -
 68
68 -
 69
69 -
 70
70 -
 71
71 -
 72
72 -
 73
73 -
 74
74 -
 75
75 -
 76
76 -
 77
77 -
 78
78 -
79
-
80
-
81
-
82
-
83
-
84
-
85
-
86
-
87
-
88
-
89
-
90
-
91
-
92
-
93
-
94
-
95
-
96
-
97
-
98
-
99
-
100
-
101
-
102
-
103
-
104
-
105
-
106
-
107
-
108
-
109
-
110
-
111
-
112
-
113
-
114
-
115
-
116
-
117
-
118
-
119
-
120
-
121
-
122
-
123
-
124
-
125
-
126
-
127
-
128
-
129
-
130
-
131
-
132
-
133
-
134
-
135
-
136
-
137
-
138
-
139
-
140
-
141
-
142
-
143
-
144
-
145
-
146
-
147
-
148
-
149
-
150
-
151
-
152
-
153
-
154
-
155
-
156
-
157
-
158
-
159
-
160
-
161
-
162
-
163
-
164
-
165
-
166
-
167
-
168
-
169
-
170
-
171
-
172
-
173
-
174
-
175
-
176
-
177
-
178
-
179
-
180
-
181
-
182
-
183
-
184
-
185
-
186
-
187
-
188
-
189
-
190
-
191
-
192
-
193
-
194
-
195
-
196
-
197
-
198
-
199
-
200
-
201
-
202
-
203
-
204
-
205
-
206
-
207
-
208
-
209
-
210
-
211
-
212
-
213
-
214
-
215
-
216
-
217
-
218
-
219
-
220
-
221
-
222
-
223
-
224
-
225
-
226
-
227
-
228
-
229
-
230
-
231
-
232
-
233
-
234
-
235
-
236
-
237
-
238
-
239
-
240
-
241
-
242
-
243
-
244
-
245
-
246
-
247
-
248
-
249
-
250
-
251
-
252
-
253
-
254
-
255
-
256
-
257
-
258
-
259
-
260
-
261
-
262
-
263
-
264
-
265
-
266
-
267
-
268
-
269
-
270
-
271
-
272
-
273
-
274
-
275
-
276
 |
 |
68
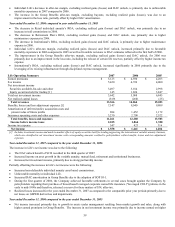
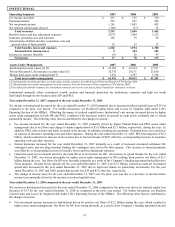
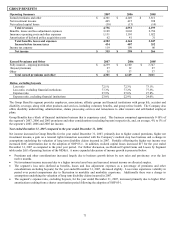
Investor Notes program. Investor Note deposits for the years ended December 31, 2006 and 2005 were $2.3 billion and $2.0
billion, respectively.
• General account spread is one of the main drivers of net income for the Institutional line of business. The increase in spread
income in 2006 was driven by higher assets under management as noted above, combined with improved partnership income. For
the year ended December 31, 2006 and 2005, income from partnership investments was $15 and $6 after-tax, respectively.
• Earned premiums increased as a result of two large terminal funding cases that were sold during 2006. This increase in earned
premiums was offset by a corresponding increase in benefits, losses and loss adjustment expenses.
• PPLI’ s net income increased compared to prior year primarily due to asset growth in the variable business combined with increased
tax benefits.
• IIP operating expenses increased in the year ended December 31, 2006 due to higher costs related to the launch of new retirement
products targeting the “baby boom” generation in 2006.
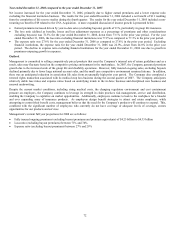
Outlook
The future net income of this segment will depend on Institutional’ s ability to increase assets under management across all businesses.
For Institutional’ s products specifically, maintenance of investment spreads and business mix are also key contributors to income.
These products are highly competitive from a pricing perspective, and a small number of cases often account for a significant portion of
deposits. Therefore, the Company may not be able to sustain the level of assets under management growth attained in 2007. Hartford
Income Notes and other structured notes products provide the Company with continued opportunity for future growth. These products
provide access to both a multi-billion dollar retail market, and a nearly trillion dollar institutional market. These markets are highly
competitive and the Company’ s success depends in part on the level of credited interest rates and the Company’ s credit rating.
As the “baby boom” generation approaches retirement, management believes these individuals will seek investment and insurance
vehicles that will give them steady streams of income throughout retirement. IIP has launched new products in 2006 and 2007 to
provide solutions that deal specifically with longevity risk. Longevity risk is defined as the likelihood of an individual outliving their
assets. IIP is also designing innovative solutions to corporations’ defined benefit liabilities.
The focus of PPLI is variable products used primarily to fund non-qualified benefits or other post employment benefit liabilities. PPLI
has experienced a surge in marketplace activity due to COLI Best Practices enacted as part of the Pension Protection Act of 2006. This
act has clarified the prior legislative uncertainty relating to insurable interest under COLI policies, potentially increasing future demand
in corporate owned life insurance. During 2007, the Company had over $5 billion in deposits. Sales activity of this magnitude may not
repeat in 2008. The market served by PPLI continues to be subject to extensive legal and regulatory scrutiny that can affect this
business.
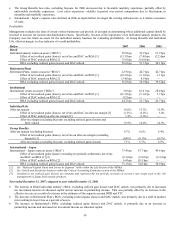
Management’ s current full year projections for 2008 are as follows:
• Deposits (including mutual funds) of $7.0 billion to $8.5 billion
• Net flows (excluding mutual funds) of $3.25 billion to $4.75 billion