The Hartford 2007 Annual Report Download - page 162
Download and view the complete annual report
Please find page 162 of the 2007 The Hartford annual report below. You can navigate through the pages in the report by either clicking on the pages listed below, or by using the keyword search tool below to find specific information within the annual report.-
 1
1 -
2
-
3
-
4
-
5
-
6
-
7
-
8
-
9
-
10
-
11
-
12
-
13
-
14
-
15
-
16
-
17
-
18
-
19
-
20
-
21
-
22
-
23
-
24
-
25
-
26
-
27
-
28
-
29
-
30
-
31
-
32
-
33
-
34
-
35
-
36
-
37
-
38
-
39
-
40
-
41
-
42
-
43
-
44
-
45
-
46
-
47
-
48
-
49
-
50
-
51
-
52
-
53
-
54
-
55
-
56
-
57
-
58
-
59
-
60
-
61
-
62
-
63
-
64
-
65
-
66
-
67
-
68
-
69
-
70
-
71
-
72
-
73
-
74
-
75
-
76
-
77
-
78
-
79
-
80
-
81
-
82
-
83
-
84
-
85
-
86
-
87
-
88
-
89
-
90
-
91
-
92
-
93
-
94
-
95
-
96
-
97
-
98
-
99
-
100
-
101
-
102
-
103
-
104
-
105
-
106
-
107
-
108
-
109
-
110
-
111
-
112
-
113
-
114
-
115
-
116
-
117
-
118
-
119
-
120
-
121
-
122
-
123
-
124
-
125
-
126
-
127
-
128
-
129
-
130
-
131
-
132
-
133
-
134
-
135
-
136
-
137
-
138
-
139
-
140
-
141
-
142
-
143
-
144
-
145
-
146
-
147
-
148
-
149
-
150
-
151
-
 152
152 -
 153
153 -
 154
154 -
 155
155 -
 156
156 -
 157
157 -
 158
158 -
 159
159 -
 160
160 -
 161
161 -
 162
162 -
 163
163 -
 164
164 -
 165
165 -
 166
166 -
 167
167 -
 168
168 -
 169
169 -
 170
170 -
 171
171 -
 172
172 -
173
-
174
-
175
-
176
-
177
-
178
-
179
-
180
-
181
-
182
-
183
-
184
-
185
-
186
-
187
-
188
-
189
-
190
-
191
-
192
-
193
-
194
-
195
-
196
-
197
-
198
-
199
-
200
-
201
-
202
-
203
-
204
-
205
-
206
-
207
-
208
-
209
-
210
-
211
-
212
-
213
-
214
-
215
-
216
-
217
-
218
-
219
-
220
-
221
-
222
-
223
-
224
-
225
-
226
-
227
-
228
-
229
-
230
-
231
-
232
-
233
-
234
-
235
-
236
-
237
-
238
-
239
-
240
-
241
-
242
-
243
-
244
-
245
-
246
-
247
-
248
-
249
-
250
-
251
-
252
-
253
-
254
-
255
-
256
-
257
-
258
-
259
-
260
-
261
-
262
-
263
-
264
-
265
-
266
-
267
-
268
-
269
-
270
-
271
-
272
-
273
-
274
-
275
-
276
 |
 |

162
31, 2007 levels, or a combination of more moderate equity market declines in scenarios where the Japanese yen significantly strengthens
against the Euro or the U.S. Dollar and interest rates rise significantly.
In addition to the Company’ s use of reinsurance, hedging instruments and other risk management techniques, the Company maintains
capital resources to, at a minimum, manage the statutory distributable earnings equity tail scenario risk described above. Given the level
of Life and Property & Casualty statutory surplus at December 31, 2007, as well as capital resources at the Corporate level, management
of the Company believes the risk inherent in these tail scenarios can be managed within the Company’ s capital resources. The
magnitude of the tail scenario estimate, described above, of $1 - $2 billion, subsequent changes to it and the width of the disclosed range
can be significantly impacted by the following factors:
• Capital market levels at the date of the projections.
• A decision to buy hedging instruments would mitigate the exposure in the tail scenario. Such decisions are made based on a variety
of factors including the price of the instrument versus the protection afforded.
• Life’ s ability to organically generate surplus in excess of that required to maintain financial strength ratings would reduce the
exposure in a tail scenario.
• Increases or decreases in surplus due to the impact capital market movements can have on the valuation of GMWB hedging
instruments. Under statutory accounting, there is no fair value recognition of an embedded derivative; however, changes in value of
the GMWB hedging instruments are recorded in capital and surplus. The tail scenario estimates described above incorporate the
dynamic hedging of GMWB. Generally, increases in the value of GMWB hedging instruments will reduce the exposure in the tail
scenario.
• Each year, Life writes new variable annuity business with existing or new living benefit guarantees, while older business, often
without living benefit guarantees, is naturally lapsing. As a result the exposure in the tail scenario is likely to increase over time.
• Changes in statutory reserving requirements, which can ultimately impact the level of capital and surplus at a point in time, can
impact the estimate of exposure in the tail scenario.
• Changes in estimates of policyholder behavior can impact the estimates of statutory distributable earnings.
• Changes in rating agency, regulatory risk based capital (“RBC”) ratios and other similar solvency margin ratios can impact the
estimate of exposure in the tail scenario.
• Management regularly evaluates the model used to produce projections of distributable earnings and incorporates changes deemed
necessary to improve the relevance and reliability of this estimate.
Foreign Currency Exchange Risk
Life’ s exposure to foreign currency exchange risk exists with respect to non-U.S. dollar denominated investments, Life’ s investment in
foreign operations, primarily Japan, and non-U.S. dollar denominated liability contracts, including the yen based individual fixed
annuity product and its GMDB,GMAB, and GMIB benefits associated with its Japanese variable annuities. A portion of the Company’ s
foreign fixed maturity currency exposure is mitigated through the use of derivatives.
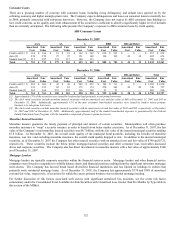
Fixed Maturity Investments
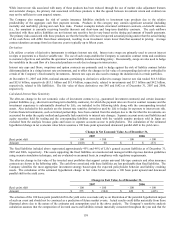
The risk associated with the non-U.S. dollar denominated fixed maturities relates to potential decreases in value and income resulting
from unfavorable changes in foreign exchange rates. The fair value of the non-U.S. dollar denominated fixed maturities, which are
primarily denominated in euro, sterling, yen and Canadian dollars, at December 31, 2007 and 2006, were approximately $1.6 billion and
$1.9 billion, respectively. In order to manage its currency exposures, Life enters into foreign currency swaps and forwards to hedge the
variability in cash flows associated with certain foreign denominated fixed maturities. These foreign currency swap agreements are
structured to match the foreign currency cash flows of the hedged foreign denominated securities. At December 31, 2007 and 2006, the
derivatives used to hedge currency exchange risk related to non-U.S. dollar denominated fixed maturities had a total notional value of
$1.5 billion and $1.6 billion, respectively, and total fair value of $(296) and $(336), respectively.
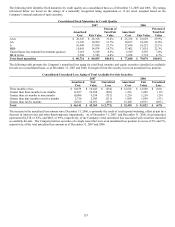
Liabilities
Life issues non-U.S. dollar denominated funding agreement liability contracts. The Company hedges the foreign currency risk
associated with these liability contracts with currency rate swaps. At December 31, 2007 and 2006, the derivatives used to hedge
foreign currency exchange risk related to foreign denominated liability contracts had a total notional value of $790 and $585,
respectively, and a total fair value of $32 and $(11), respectively.
The yen based fixed annuity product is written by Hartford Life Insurance K.K. (“HLIKK”), a wholly-owned Japanese subsidiary of
Hartford Life, Inc. (“HLI”), and subsequently reinsured to Hartford Life Insurance Company, a U.S. dollar based wholly-owned indirect
subsidiary of HLI. The underlying investment involves investing in U.S. securities markets, which offer favorable credit spreads. The
yen denominated fixed annuity product (“yen fixed annuities”) is recorded in the consolidated balance sheets with invested assets
denominated in dollars while policyholder liabilities are denominated in yen and converted to U.S. dollars based upon the December 31,
yen to U.S. dollar spot rate. The difference between U.S. dollar denominated investments and yen denominated liabilities exposes the