The Hartford 2007 Annual Report Download - page 214
Download and view the complete annual report
Please find page 214 of the 2007 The Hartford annual report below. You can navigate through the pages in the report by either clicking on the pages listed below, or by using the keyword search tool below to find specific information within the annual report.-
 1
1 -
2
-
3
-
4
-
5
-
6
-
7
-
8
-
9
-
10
-
11
-
12
-
13
-
14
-
15
-
16
-
17
-
18
-
19
-
20
-
21
-
22
-
23
-
24
-
25
-
26
-
27
-
28
-
29
-
30
-
31
-
32
-
33
-
34
-
35
-
36
-
37
-
38
-
39
-
40
-
41
-
42
-
43
-
44
-
45
-
46
-
47
-
48
-
49
-
50
-
51
-
52
-
53
-
54
-
55
-
56
-
57
-
58
-
59
-
60
-
61
-
62
-
63
-
64
-
65
-
66
-
67
-
68
-
69
-
70
-
71
-
72
-
73
-
74
-
75
-
76
-
77
-
78
-
79
-
80
-
81
-
82
-
83
-
84
-
85
-
86
-
87
-
88
-
89
-
90
-
91
-
92
-
93
-
94
-
95
-
96
-
97
-
98
-
99
-
100
-
101
-
102
-
103
-
104
-
105
-
106
-
107
-
108
-
109
-
110
-
111
-
112
-
113
-
114
-
115
-
116
-
117
-
118
-
119
-
120
-
121
-
122
-
123
-
124
-
125
-
126
-
127
-
128
-
129
-
130
-
131
-
132
-
133
-
134
-
135
-
136
-
137
-
138
-
139
-
140
-
141
-
142
-
143
-
144
-
145
-
146
-
147
-
148
-
149
-
150
-
151
-
152
-
153
-
154
-
155
-
156
-
157
-
158
-
159
-
160
-
161
-
162
-
163
-
164
-
165
-
166
-
167
-
168
-
169
-
170
-
171
-
172
-
173
-
174
-
175
-
176
-
177
-
178
-
179
-
180
-
181
-
182
-
183
-
184
-
185
-
186
-
187
-
188
-
189
-
190
-
191
-
192
-
193
-
194
-
195
-
196
-
197
-
198
-
199
-
200
-
201
-
202
-
203
-
 204
204 -
 205
205 -
 206
206 -
 207
207 -
 208
208 -
 209
209 -
 210
210 -
 211
211 -
 212
212 -
 213
213 -
 214
214 -
 215
215 -
 216
216 -
 217
217 -
 218
218 -
 219
219 -
 220
220 -
 221
221 -
 222
222 -
 223
223 -
 224
224 -
225
-
226
-
227
-
228
-
229
-
230
-
231
-
232
-
233
-
234
-
235
-
236
-
237
-
238
-
239
-
240
-
241
-
242
-
243
-
244
-
245
-
246
-
247
-
248
-
249
-
250
-
251
-
252
-
253
-
254
-
255
-
256
-
257
-
258
-
259
-
260
-
261
-
262
-
263
-
264
-
265
-
266
-
267
-
268
-
269
-
270
-
271
-
272
-
273
-
274
-
275
-
276
 |
 |

THE HARTFORD FINANCIAL SERVICES GROUP, INC.
NOTES TO CONSOLIDATED FINANCIAL STATEMENTS (continued)
F-37
4. Investments and Derivative Instruments (continued)
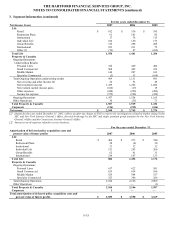
Concentration of Credit Risk
The Company aims to maintain a diversified investment portfolio including issuer, sector and geographic stratification, where
applicable, and has established certain exposure limits, diversification standards and review procedures to mitigate credit risk.
The Company is not exposed to any concentration of credit risk of a single issuer greater than 10% of the Company’ s stockholders’
equity other than U.S. government and certain U.S. government agencies. Other than U.S. government and U.S. government agencies,
the Company’ s largest three exposures by issuer including multiple investment grade tranches of the same security as of December 31,
2007 were the Wachovia Bank Commercial Mortgage Trust, State of California and Goldman Equity Office Properties and as of
December 31, 2006 were the Wachovia Bank Commercial Mortgage Trust, State of California, and General Electric Company, which
each comprise less than 0.5%, of total invested assets. Wachovia Bank Commercial Mortgage Trust and Goldman Equity Office
Properties include multiple investment grade tranches.
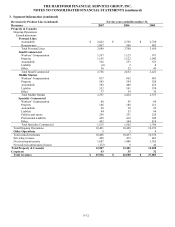
The Company’ s largest three exposures by sector, as of December 31, 2007 and 2006 were commercial mortgage and real estate, state
municipalities and political subdivisions, and financial services which comprised approximately 18%, 10%, and 10%, respectively, for
2007, and 17%, 10%, and 9%, respectively, for 2006, of total invested assets.
The Company’ s investments in states, municipalities and political subdivisions are geographically dispersed throughout the United
States. The largest concentrations, as of December 31, 2007 and 2006, were in California, New York and Illinois which each comprise
2%, respectively, or less of total invested assets.
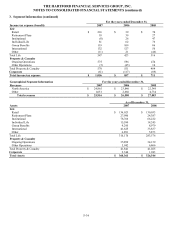
Security Unrealized Loss Aging
The Company has a security monitoring process overseen by a committee of investment and accounting professionals that, on a
quarterly basis, identifies securities in an unrealized loss position that could potentially be other-than-temporarily impaired. For further
discussion regarding the Company’s other-than-temporary impairment policy, see the Investments section of Note 1. Due to the
issuers’ continued satisfaction of the securities’ obligations in accordance with their contractual terms and the expectation that they will
continue to do so, management’ s intent and ability to hold these securities for a period of time sufficient to allow for any anticipated
recovery in market value, as well as the evaluation of the fundamentals of the issuers’ financial condition and other objective evidence,
the Company believes that the prices of the securities in the sectors identified in the tables below were temporarily depressed as of
December 31, 2007 and 2006.
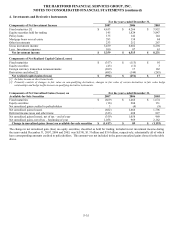
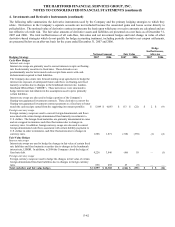
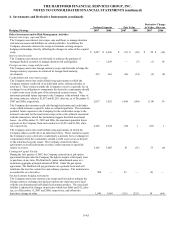
The following table presents amortized cost, fair value and unrealized losses for the Company’ s fixed maturity and available-for-sale
equity securities, aggregated by investment category and length of time that individual securities have been in a continuous unrealized
loss position as of December 31, 2007.
2007
Less Than 12 Months 12 Months or More Total
Amortized
Cost
Fair
Value
Unrealized
Losses
Amortized
Cost
Fair
Value
Unrealized
Losses
Amortized
Cost
Fair
Value
Unrealized
Losses
ABS $ 7,811 $ 7,222 $ (589) $ 671 $ 627 $ (44) $ 8,482 $ 7,849 $ (633)
CMOs
Agency backed 324 321 (3) 89 88 (1) 413 409 (4)
Non-agency backed 120 118 (2) 54 53 (1) 174 171 (3)
CMBS 8,138 7,453 (685) 3,400 3,247 (153) 11,538 10,700 (838)
Corporate 13,849 13,165 (684) 4,873 4,615 (258) 18,722 17,780 (942)
Government/Government agencies
Foreign 226 221 (5) 66 66 — 292 287 (5)
United States 216 213 (3) 14 14 — 230 227 (3)
MBS 56 56 — 1,033 1,013 (20) 1,089 1,069 (20)
States, municipalities and political
subdivisions
3,157
3,081
(76)
342
328
(14)
3,499
3,409
(90)
Redeemable preferred stock 6 6 — — — — 6 6 —
Total fixed maturities 33,903 31,856 (2,047) 10,542 10,051 (491) 44,445 41,907 (2,538)
Common stock 128 121 (7) — — — 128 121 (7)
Non-redeemable preferred stock 1,547 1,321 (226) 21 20 (1) 1,568 1,341 (227)
Total equity 1,675 1,442 (233) 21 20 (1) 1,696 1,462 (234)
Total temporarily impaired securities $ 35,578 $ 33,298 $ (2,280) $ 10,563 $ 10,071 $ (492) $ 46,141 $ 43,369 $ (2,772)