The Hartford 2007 Annual Report Download - page 108
Download and view the complete annual report
Please find page 108 of the 2007 The Hartford annual report below. You can navigate through the pages in the report by either clicking on the pages listed below, or by using the keyword search tool below to find specific information within the annual report.-
 1
1 -
2
-
3
-
4
-
5
-
6
-
7
-
8
-
9
-
10
-
11
-
12
-
13
-
14
-
15
-
16
-
17
-
18
-
19
-
20
-
21
-
22
-
23
-
24
-
25
-
26
-
27
-
28
-
29
-
30
-
31
-
32
-
33
-
34
-
35
-
36
-
37
-
38
-
39
-
40
-
41
-
42
-
43
-
44
-
45
-
46
-
47
-
48
-
49
-
50
-
51
-
52
-
53
-
54
-
55
-
56
-
57
-
58
-
59
-
60
-
61
-
62
-
63
-
64
-
65
-
66
-
67
-
68
-
69
-
70
-
71
-
72
-
73
-
74
-
75
-
76
-
77
-
78
-
79
-
80
-
81
-
82
-
83
-
84
-
85
-
86
-
87
-
88
-
89
-
90
-
91
-
92
-
93
-
94
-
95
-
96
-
97
-
 98
98 -
 99
99 -
 100
100 -
 101
101 -
 102
102 -
 103
103 -
 104
104 -
 105
105 -
 106
106 -
 107
107 -
 108
108 -
 109
109 -
 110
110 -
 111
111 -
 112
112 -
 113
113 -
 114
114 -
 115
115 -
 116
116 -
 117
117 -
 118
118 -
119
-
120
-
121
-
122
-
123
-
124
-
125
-
126
-
127
-
128
-
129
-
130
-
131
-
132
-
133
-
134
-
135
-
136
-
137
-
138
-
139
-
140
-
141
-
142
-
143
-
144
-
145
-
146
-
147
-
148
-
149
-
150
-
151
-
152
-
153
-
154
-
155
-
156
-
157
-
158
-
159
-
160
-
161
-
162
-
163
-
164
-
165
-
166
-
167
-
168
-
169
-
170
-
171
-
172
-
173
-
174
-
175
-
176
-
177
-
178
-
179
-
180
-
181
-
182
-
183
-
184
-
185
-
186
-
187
-
188
-
189
-
190
-
191
-
192
-
193
-
194
-
195
-
196
-
197
-
198
-
199
-
200
-
201
-
202
-
203
-
204
-
205
-
206
-
207
-
208
-
209
-
210
-
211
-
212
-
213
-
214
-
215
-
216
-
217
-
218
-
219
-
220
-
221
-
222
-
223
-
224
-
225
-
226
-
227
-
228
-
229
-
230
-
231
-
232
-
233
-
234
-
235
-
236
-
237
-
238
-
239
-
240
-
241
-
242
-
243
-
244
-
245
-
246
-
247
-
248
-
249
-
250
-
251
-
252
-
253
-
254
-
255
-
256
-
257
-
258
-
259
-
260
-
261
-
262
-
263
-
264
-
265
-
266
-
267
-
268
-
269
-
270
-
271
-
272
-
273
-
274
-
275
-
276
 |
 |

108
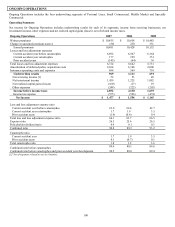
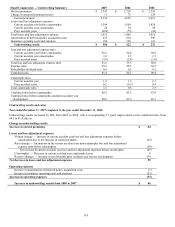
has increased in auto and homeowners. The growth in policies in-force does not correspond directly with the growth in earned
premiums due to the effect of earned pricing changes and because policy in-force counts are as of a point in time rather than over a
period of time.
Auto new business written premium increased by $43, or 10%, to $469 in 2006. The increase in new business written premium was
primarily due to an increase in AARP and Agency new business, partially offset by a decrease in other new business. Growth in new
business was particularly strong in AARP with a growth rate of 20% in 2006. Homeowners’ new business written premium increased
by $30, or 23%, to $161 in 2006. The increase in homeowners’ new business written premium was due to an increase in both AARP
and Agency new business.
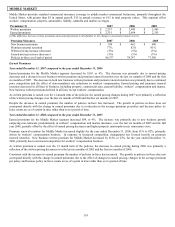
Premium renewal retention in 2006 for auto of 87% and for homeowners of 94% remained flat from the prior year. For auto, overall
premium renewal retention was flat, despite a decrease in retention for Agency auto. For homeowners, an increase in retention of
AARP business was offset by a decrease in retention of Agency business. Premium renewal retention for Agency auto decreased due to
a shift to more six month policies that have a lower retention rate.
The trend in earned pricing during 2006 was primarily a reflection of the written pricing changes in the last six months of 2005 and the
first six months of 2006. Auto written pricing decreases are driven by an extended period of favorable results factoring into the rate
setting process. Homeowners’ written pricing continues to increase moderately due to insurance to value increases.
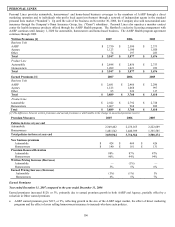
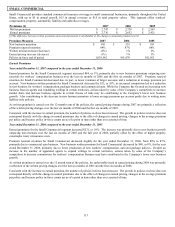
Personal Lines —Underwriting Summary 2007 2006 2005
Written premiums $ 3,947 $ 3,877 $ 3,676
Change in unearned premium reserve 58 117 66
Earned premiums 3,889 3,760 3,610
Losses and loss adjustment expenses
Current accident year before catastrophes 2,576 2,396 2,291
Current accident year catastrophes 125 120 98
Prior accident years (4) (38) (95)
Total losses and loss adjustment expenses 2,697 2,478 2,294
Amortization of deferred policy acquisition costs 617 622 581
Insurance operating costs and expenses 253 231 275
Underwriting results $ 322 $ 429 $ 460
Loss and loss adjustment expense ratio
Current accident year before catastrophes 66.2 63.8 63.5
Current accident year catastrophes 3.2 3.2 2.7
Prior accident years (0.1) (1.0) (2.6)
Total loss and loss adjustment expense ratio 69.3 65.9 63.6
Expense ratio 22.4 22.7 23.7
Combined ratio 91.7 88.6 87.3
Catastrophe ratio
Current accident year 3.2 3.2 2.7
Prior accident years 0.2 (0.4) 0.2
Total catastrophe ratio 3.4 2.8 2.9
Combined ratio before catastrophes 88.3 85.8 84.4
Combined ratio before catastrophes and prior accident year development 88.6 86.4 87.2
Other revenues [1] $ 141 $ 135 $ 121
[1] Represents servicing revenue
Combined Ratios
Automobile 96.2 93.6 90.7
Homeowners 79.8 74.0 76.6
Total 91.7 88.6 87.3