The Hartford 2007 Annual Report Download - page 160
Download and view the complete annual report
Please find page 160 of the 2007 The Hartford annual report below. You can navigate through the pages in the report by either clicking on the pages listed below, or by using the keyword search tool below to find specific information within the annual report.-
 1
1 -
2
-
3
-
4
-
5
-
6
-
7
-
8
-
9
-
10
-
11
-
12
-
13
-
14
-
15
-
16
-
17
-
18
-
19
-
20
-
21
-
22
-
23
-
24
-
25
-
26
-
27
-
28
-
29
-
30
-
31
-
32
-
33
-
34
-
35
-
36
-
37
-
38
-
39
-
40
-
41
-
42
-
43
-
44
-
45
-
46
-
47
-
48
-
49
-
50
-
51
-
52
-
53
-
54
-
55
-
56
-
57
-
58
-
59
-
60
-
61
-
62
-
63
-
64
-
65
-
66
-
67
-
68
-
69
-
70
-
71
-
72
-
73
-
74
-
75
-
76
-
77
-
78
-
79
-
80
-
81
-
82
-
83
-
84
-
85
-
86
-
87
-
88
-
89
-
90
-
91
-
92
-
93
-
94
-
95
-
96
-
97
-
98
-
99
-
100
-
101
-
102
-
103
-
104
-
105
-
106
-
107
-
108
-
109
-
110
-
111
-
112
-
113
-
114
-
115
-
116
-
117
-
118
-
119
-
120
-
121
-
122
-
123
-
124
-
125
-
126
-
127
-
128
-
129
-
130
-
131
-
132
-
133
-
134
-
135
-
136
-
137
-
138
-
139
-
140
-
141
-
142
-
143
-
144
-
145
-
146
-
147
-
148
-
149
-
 150
150 -
 151
151 -
 152
152 -
 153
153 -
 154
154 -
 155
155 -
 156
156 -
 157
157 -
 158
158 -
 159
159 -
 160
160 -
 161
161 -
 162
162 -
 163
163 -
 164
164 -
 165
165 -
 166
166 -
 167
167 -
 168
168 -
 169
169 -
 170
170 -
171
-
172
-
173
-
174
-
175
-
176
-
177
-
178
-
179
-
180
-
181
-
182
-
183
-
184
-
185
-
186
-
187
-
188
-
189
-
190
-
191
-
192
-
193
-
194
-
195
-
196
-
197
-
198
-
199
-
200
-
201
-
202
-
203
-
204
-
205
-
206
-
207
-
208
-
209
-
210
-
211
-
212
-
213
-
214
-
215
-
216
-
217
-
218
-
219
-
220
-
221
-
222
-
223
-
224
-
225
-
226
-
227
-
228
-
229
-
230
-
231
-
232
-
233
-
234
-
235
-
236
-
237
-
238
-
239
-
240
-
241
-
242
-
243
-
244
-
245
-
246
-
247
-
248
-
249
-
250
-
251
-
252
-
253
-
254
-
255
-
256
-
257
-
258
-
259
-
260
-
261
-
262
-
263
-
264
-
265
-
266
-
267
-
268
-
269
-
270
-
271
-
272
-
273
-
274
-
275
-
276
 |
 |
160
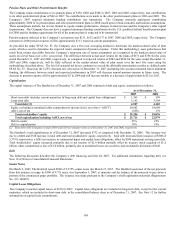
Company’ s DAC models. Current period revenues are impacted by actual increases or decreases in account value. Claims recorded
against the liability have no immediate impact on the income statement unless those claims exceed the liability. As a result of these
significant accounting differences the liability for guarantees recorded under SOP 03-1 may be significantly different than if it was
recorded under SFAS 133 and vice versa. In addition, the conditions in the capital markets in Japan vs. those in the U.S. are sufficiently
different than if the Company’ s GMWB product currently offered in the U.S. were offered in Japan, the capital market conditions in
Japan would have a significant impact on the valuation of the GMWB, irrespective of the accounting model. The same would hold true
if the Company’ s GMIB product currently offered in Japan were to be offered in the U.S. Capital market conditions in the U.S. would
have a significant impact on the valuation of the GMIB. Many benefit guarantees meet the definition of an embedded derivative, under
SFAS 133 (GMWB and GMAB), and as such are recorded at fair value with changes in fair value recorded in net income. However,
certain contract features that define how the contract holder can access the value and the substance of the guaranteed benefit change the
accounting from SFAS 133 to SOP 03-1. For contracts where the contract holder can only obtain the value of the guaranteed benefit
upon the occurrence of an insurable event such as death (GMDB) or when the benefit received is in substance a long-term financing
(GMIB), the accounting for the benefit is prescribed by SOP 03-1.
In the U.S., the Company sells variable annuity contracts that offer various guaranteed death benefits. The Company maintains a
liability, under SOP 03-1, for the death benefit costs of $529, as of December 31, 2007. Declines in the equity market may increase the
Company’ s net exposure to death benefits under these contracts. The majority of the contracts with the guaranteed death benefit feature
are sold by the Retail segment. For certain guaranteed death benefits, The Hartford pays the greater of (1) the account value at death;
(2) the sum of all premium payments less prior withdrawals; or (3) the maximum anniversary value of the contract, plus any premium
payments since the contract anniversary, minus any withdrawals following the contract anniversary.
For certain guaranteed death benefits sold with variable annuity contracts beginning in June 2003, the Retail segment pays the greater of
(1) the account value at death; or (2) the maximum anniversary value; not to exceed the account value plus the greater of (a) 25% of
premium payments, or (b) 25% of the maximum anniversary value of the contract. The Company currently reinsures a significant
portion of these death benefit guarantees associated with its in-force block of business. Under certain of these reinsurance agreements,
the reinsurers’ exposure is subject to an annual cap.
The Company’ s total gross exposure (i.e., before reinsurance) to these guaranteed death benefits as of December 31, 2007 is $5.1
billion. Due to the fact that 81% of this amount is reinsured, the Company’ s net exposure is $976. This amount is often referred to as
the retained net amount at risk. However, the Company will incur these guaranteed death benefit payments in the future only if the
policyholder has an in-the-money guaranteed death benefit at their time of death.
In Japan, the Company offers certain variable annuity products with both a guaranteed death benefit and a guaranteed income benefit.
The Company maintains a liability for these death and income benefits, under SOP 03-1, of $42 as of December 31, 2007. Declines in
equity markets as well as a strengthening of the Japanese yen in comparison to the U.S. dollar and other currencies may increase the
Company’ s exposure to these guaranteed benefits. This increased exposure may be significant in extreme market scenarios. For the
guaranteed death benefits, the Company pays the greater of (1) account value at death; (2) a guaranteed death benefit which, depending
on the contract, may be based upon the premium paid and/or the maximum anniversary value established no later than age 80, as
adjusted for withdrawals under the terms of the contract. With the exception of the GMIB in 3 Win as described above, the guaranteed
income benefit guarantees to return the contract holder’ s initial investment, adjusted for any earnings withdrawals, through periodic
payments that commence at the end of a minimum deferral period of 10, 15 or 20 years as elected by the contract holder. The value of
the GMAB associated with Japan’ s new product offering in the first quarter of 2007, recorded as an embedded derivative under SFAS
133, was an asset of $2 at December 31, 2007.
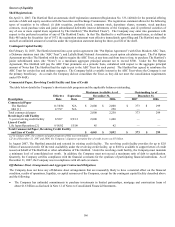
In April 2006, the Company entered into an indemnity reinsurance agreement with an unrelated party. Under this agreement, the
reinsurer will reimburse the Company for death benefit claims, up to an annual cap, incurred for certain death benefit guarantees
associated with an in-force block of variable annuity products offered in Japan with an account value of $2.3 billion as of December 31,
2007.
The Company’s total gross exposure (i.e., before reinsurance) to these guaranteed death benefits and income benefits offered in Japan as
of December 31, 2007 is $649. Due to the fact that 35% of this amount is reinsured, the Company’ s net exposure is $419. This amount
is often referred to as the retained net amount at risk. However, the Company will incur these guaranteed death or income benefits in
the future only if the contract holder has an in-the-money guaranteed benefit at either the time of their death or if the account value is
insufficient to fund the guaranteed living benefits.
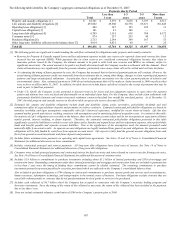
The majority of the Company’ s recent U.S. variable annuities are sold with a GMWB living benefit rider, which, as described above, is
accounted for under SFAS 133. Declines in the equity market may increase the Company’ s exposure to benefits under the GMWB
contracts. For all contracts in effect through July 6, 2003, the Company entered into a reinsurance arrangement to offset its exposure to
the GMWB for the remaining lives of those contracts. Substantially all U.S. GMWB riders sold since July 6, 2003 are not covered by
reinsurance. These unreinsured contracts generate volatility in net income each quarter as the underlying embedded derivative liabilities
are recorded at fair value each reporting period, resulting in the recognition of net realized capital gains or losses in response to changes
in certain critical factors including capital market conditions and policyholder behavior. In order to minimize the volatility associated
with the unreinsured GMWB liabilities, the Company established an alternative risk management strategy.