The Hartford 2007 Annual Report Download - page 75
Download and view the complete annual report
Please find page 75 of the 2007 The Hartford annual report below. You can navigate through the pages in the report by either clicking on the pages listed below, or by using the keyword search tool below to find specific information within the annual report.-
 1
1 -
2
-
3
-
4
-
5
-
6
-
7
-
8
-
9
-
10
-
11
-
12
-
13
-
14
-
15
-
16
-
17
-
18
-
19
-
20
-
21
-
22
-
23
-
24
-
25
-
26
-
27
-
28
-
29
-
30
-
31
-
32
-
33
-
34
-
35
-
36
-
37
-
38
-
39
-
40
-
41
-
42
-
43
-
44
-
45
-
46
-
47
-
48
-
49
-
50
-
51
-
52
-
53
-
54
-
55
-
56
-
57
-
58
-
59
-
60
-
61
-
62
-
63
-
64
-
 65
65 -
 66
66 -
 67
67 -
 68
68 -
 69
69 -
 70
70 -
 71
71 -
 72
72 -
 73
73 -
 74
74 -
 75
75 -
 76
76 -
 77
77 -
 78
78 -
 79
79 -
 80
80 -
 81
81 -
 82
82 -
 83
83 -
 84
84 -
 85
85 -
86
-
87
-
88
-
89
-
90
-
91
-
92
-
93
-
94
-
95
-
96
-
97
-
98
-
99
-
100
-
101
-
102
-
103
-
104
-
105
-
106
-
107
-
108
-
109
-
110
-
111
-
112
-
113
-
114
-
115
-
116
-
117
-
118
-
119
-
120
-
121
-
122
-
123
-
124
-
125
-
126
-
127
-
128
-
129
-
130
-
131
-
132
-
133
-
134
-
135
-
136
-
137
-
138
-
139
-
140
-
141
-
142
-
143
-
144
-
145
-
146
-
147
-
148
-
149
-
150
-
151
-
152
-
153
-
154
-
155
-
156
-
157
-
158
-
159
-
160
-
161
-
162
-
163
-
164
-
165
-
166
-
167
-
168
-
169
-
170
-
171
-
172
-
173
-
174
-
175
-
176
-
177
-
178
-
179
-
180
-
181
-
182
-
183
-
184
-
185
-
186
-
187
-
188
-
189
-
190
-
191
-
192
-
193
-
194
-
195
-
196
-
197
-
198
-
199
-
200
-
201
-
202
-
203
-
204
-
205
-
206
-
207
-
208
-
209
-
210
-
211
-
212
-
213
-
214
-
215
-
216
-
217
-
218
-
219
-
220
-
221
-
222
-
223
-
224
-
225
-
226
-
227
-
228
-
229
-
230
-
231
-
232
-
233
-
234
-
235
-
236
-
237
-
238
-
239
-
240
-
241
-
242
-
243
-
244
-
245
-
246
-
247
-
248
-
249
-
250
-
251
-
252
-
253
-
254
-
255
-
256
-
257
-
258
-
259
-
260
-
261
-
262
-
263
-
264
-
265
-
266
-
267
-
268
-
269
-
270
-
271
-
272
-
273
-
274
-
275
-
276
 |
 |

75
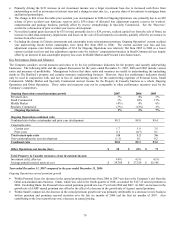
OTHER
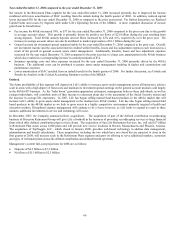
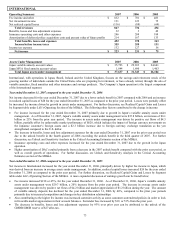
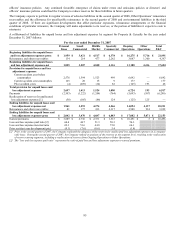
Operating Summary 2007 2006 2005
Fee income and other $ 67 $ 81 $ 83
Net investment income
Securities available-for-sale and other 145 154 174
Equity securities held for trading [1] 145 1,824 3,847
Total net investment income 290 1,978 4,021
Net realized capital gains (losses) (35) 6 20
Total revenues 322 2,065 4,124
Benefits, losses and loss adjustment expenses [1] 301 1,985 4,166
Insurance operating costs and other expenses 84 12 106
Total benefits, losses and expenses 385 1,997 4,272
Income (loss) before income taxes (63) 68 (148)
Income tax expense (benefit) (11) 21 (46)
Net income (loss) $ (52) $47 $(102)
[1] Includes investment income and mark-to-market effects of equity securities held for trading supporting the international variable annuity business,
which are classified in net investment income with corresponding amounts credited to policyholders within benefits, losses and loss adjustment
expenses.
Life includes in Other its leveraged PPLI product line of business; corporate items not directly allocated to any of its reporting
segments; inter-segment eliminations and the mark-to-mark adjustment for the International variable annuity assets that are classified as
equity securities held for trading reported in net investment income and the related change in interest credited reported as a component
of benefits, losses and loss adjustment expenses since these items are not considered by the Company’ s chief operating decision maker
in evaluating the International results of operations.
Net investment income includes the mark-to-market adjustment for equity securities held for trading which decreased primarily due to
decreased fund performance of Japan variable annuities. This decrease in net investment income is offset by a decrease in benefit,
losses and loss adjustment expenses which reflects the interest credited on the Japan account balance liability.
Year ended December 31, 2007 compared to the year ended December 31, 2006
• During the first quarter of 2006, the Company achieved favorable settlements in several cases brought against the Company by
policyholders regarding their purchase of broad-based leveraged corporate owned life insurance ("leveraged COLI") policies in the
early to mid-1990s. The Company ceased offering this product in 1996. Based on the favorable outcome of these cases, together
with the Company's current assessment of the few remaining leveraged COLI cases, the Company reduced its estimate of the
ultimate cost of these cases as of June 30, 2006. This reserve reduction, recorded in insurance operating costs and other expenses,
resulted in an after-tax benefit of $34.
• Also contributing to the increase in insurance operating costs and other expenses was $18, after-tax, of interest charged by
Corporate on the amount of capital held by the Life operations in excess of the amount needed to support the capital requirements
of the Life Operations for the year ended December 31, 2007.
• The Company recorded a reserve in the second quarter of 2007 for market regulatory matters of $21, after-tax. During the year, the
Company recorded an insurance recovery of $9, after-tax, against the litigation costs associated with the regulatory matters.
• Refer to Realized Capital Gains and Losses by Segment table under Life’ s Operating section of the MD&A.
Year ended December 31, 2006 compared to the year ended December 31, 2005
The change in Other’ s net income was due to the following:
• Life recorded an after-tax charge of $102 for the year ended December 31, 2005 to establish reserves for regulatory matters for
investigations related to market timing by the SEC and New York Attorney General’ s Office, directed brokerage by the SEC, and
single premium group annuities by the New York Attorney General’ s Office and the Connecticut Attorney General’ s Office.
• During 2006, the Company achieved favorable settlements in several cases brought against the Company by policyholders
regarding their purchase of broad-based leveraged corporate owned life insurance ("leveraged COLI") policies in the early to mid-
1990s. The Company ceased offering this product in 1996. Based on the favorable outcome of these cases, together with the
Company's current assessment of the few remaining leveraged COLI cases, the Company reduced its estimate of the ultimate cost
of these cases during 2006. This reserve reduction, recorded in insurance operating costs and other expenses, resulted in an after-
tax benefit of $34.
• Also contributing to the insurance operating costs and other expenses decreases for the year ended December 31, 2006 was a lower
level of dividends to leveraged COLI policyholders.
• During 2005, the Company recorded a charge of $18, after-tax, related to the settlement of certain annuity contracts.