The Hartford 2007 Annual Report Download - page 56
Download and view the complete annual report
Please find page 56 of the 2007 The Hartford annual report below. You can navigate through the pages in the report by either clicking on the pages listed below, or by using the keyword search tool below to find specific information within the annual report.-
 1
1 -
2
-
3
-
4
-
5
-
6
-
7
-
8
-
9
-
10
-
11
-
12
-
13
-
14
-
15
-
16
-
17
-
18
-
19
-
20
-
21
-
22
-
23
-
24
-
25
-
26
-
27
-
28
-
29
-
30
-
31
-
32
-
33
-
34
-
35
-
36
-
37
-
38
-
39
-
40
-
41
-
42
-
43
-
44
-
45
-
 46
46 -
 47
47 -
 48
48 -
 49
49 -
 50
50 -
 51
51 -
 52
52 -
 53
53 -
 54
54 -
 55
55 -
 56
56 -
 57
57 -
 58
58 -
 59
59 -
 60
60 -
 61
61 -
 62
62 -
 63
63 -
 64
64 -
 65
65 -
 66
66 -
67
-
68
-
69
-
70
-
71
-
72
-
73
-
74
-
75
-
76
-
77
-
78
-
79
-
80
-
81
-
82
-
83
-
84
-
85
-
86
-
87
-
88
-
89
-
90
-
91
-
92
-
93
-
94
-
95
-
96
-
97
-
98
-
99
-
100
-
101
-
102
-
103
-
104
-
105
-
106
-
107
-
108
-
109
-
110
-
111
-
112
-
113
-
114
-
115
-
116
-
117
-
118
-
119
-
120
-
121
-
122
-
123
-
124
-
125
-
126
-
127
-
128
-
129
-
130
-
131
-
132
-
133
-
134
-
135
-
136
-
137
-
138
-
139
-
140
-
141
-
142
-
143
-
144
-
145
-
146
-
147
-
148
-
149
-
150
-
151
-
152
-
153
-
154
-
155
-
156
-
157
-
158
-
159
-
160
-
161
-
162
-
163
-
164
-
165
-
166
-
167
-
168
-
169
-
170
-
171
-
172
-
173
-
174
-
175
-
176
-
177
-
178
-
179
-
180
-
181
-
182
-
183
-
184
-
185
-
186
-
187
-
188
-
189
-
190
-
191
-
192
-
193
-
194
-
195
-
196
-
197
-
198
-
199
-
200
-
201
-
202
-
203
-
204
-
205
-
206
-
207
-
208
-
209
-
210
-
211
-
212
-
213
-
214
-
215
-
216
-
217
-
218
-
219
-
220
-
221
-
222
-
223
-
224
-
225
-
226
-
227
-
228
-
229
-
230
-
231
-
232
-
233
-
234
-
235
-
236
-
237
-
238
-
239
-
240
-
241
-
242
-
243
-
244
-
245
-
246
-
247
-
248
-
249
-
250
-
251
-
252
-
253
-
254
-
255
-
256
-
257
-
258
-
259
-
260
-
261
-
262
-
263
-
264
-
265
-
266
-
267
-
268
-
269
-
270
-
271
-
272
-
273
-
274
-
275
-
276
 |
 |

56
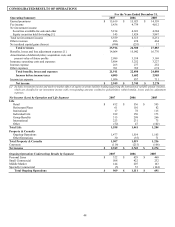
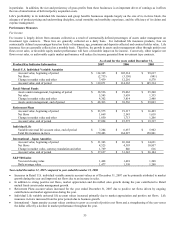
Year ended December 31, 2006 compared to year ended December 31, 2005
• The increase in Retail U.S. individual variable annuity account values can be attributed primarily to market growth during 2006.
• Net flows for the Retail U.S. individual variable annuity business were negative and have worsened from prior year levels resulting
from higher surrenders outpacing increased deposits due primarily to increased competition in the living benefit market.
• Mutual fund net sales increased substantially over the prior year as a result of focused wholesaling efforts and favorable fund and
equity market performance.
• The increase in Retirement Plans account values is due to positive net flows over the past year due to higher deposits and market
appreciation.
• Individual Life variable universal life account value increased due primarily to premiums, deposits and market appreciation. Life
insurance in-force increased from December 31, 2005 due to business growth.
• International - Japan annuity account values as of December 31, 2006 were higher as a result of positive net flows and fund
performance, offset by the effects of currency translation. Japan net flows have decreased from the prior year due to increased
competition.
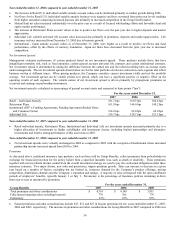
Net Investment Spread
Management evaluates performance of certain products based on net investment spread. These products include those that have
insignificant mortality risk, such as fixed annuities, certain general account universal life contracts and certain institutional contracts.
Net investment spread is determined by taking the difference between the earned rate and the related crediting rates on average assets
under management. The net investment spreads shown below are for the total portfolio of relevant contracts in each segment and reflect
business written at different times. When pricing products, the Company considers current investment yields and not the portfolio
average. Net investment spread can be volatile period over period, which can have a significant positive or negative effect on the
operating results of each segment. The volatile nature of net investment spread is driven primarily by prepayment premiums on
securities and earnings on partnership investments.
Net investment spread is calculated as a percentage of general account assets and expressed in basis points (“bps”):
For the years ended December 31,
2007 2006 2005
Retail – Individual Annuity 181.1 bps 160.3 bps 160.4 bps
Retirement Plans 161.0 bps 146.0 bps 149.2 bps
Institutional (GIC’ s, Funding Agreements, Funding Agreement Backed Notes
and Consumer Notes)
124.0 bps
82.0 bps
60.0 bps
Individual Life 136.7 bps 124.7 bps 123.3 bps
Year ended December 31, 2007 compared to year ended December 31, 2006
• Retail individual annuity, Retirement Plans, Institutional and Individual Life net investment spreads increased primarily due to a
higher allocation of investments in higher yield/higher risk investment classes, including limited partnerships and alternative
investments and relative strong performance of this asset class in 2007.
Year ended December 31, 2006 compared to year ended December 31, 2005
• Net investment spreads were virtually unchanged in 2006 as compared to 2005 with the exception of Institutional where increased
partnership income increased spread from 2005 to 2006.
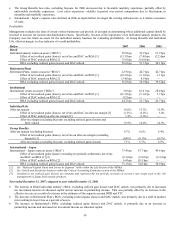
Premiums
As discussed above, traditional insurance type products, such as those sold by Group Benefits, collect premiums from policyholders in
exchange for financial protection for the policy holder from a specified insurable loss, such as death or disability. These premiums
together with net investment income earned from the overall investment strategy are used to pay the contractual obligations under these
insurance contracts. Two major factors, new sales and persistency, impact premium growth. Sales can increase or decrease in a given
year based on a number of factors, including but not limited to, customer demand for the Company’ s product offerings, pricing
competition, distribution channels and the Company’ s reputation and ratings. A majority of sales correspond with the open enrollment
periods of employers’ benefits, typically January 1 or July 1. Persistency is the percentage of insurance policies remaining in-force
from year to year as measured by premiums.
For the years ended December 31,
Group Benefits 2007 2006 2005
Total premiums and other considerations $ 4,301 $ 4,149 $ 3,811
Fully insured ongoing sales (excluding buyouts) 770 861 779
Persistency 87% 87% 87%
• Earned premiums and other considerations include $27, $12 and $27 in buyout premiums for the years ended December 31, 2007,
2006 and 2005, respectively. The increase in premiums and other considerations for Group Benefits in 2007 compared to 2006 was