Virgin Media 2012 Annual Report Download - page 95
Download and view the complete annual report
Please find page 95 of the 2012 Virgin Media annual report below. You can navigate through the pages in the report by either clicking on the pages listed below, or by using the keyword search tool below to find specific information within the annual report.-
 1
1 -
2
-
3
-
4
-
5
-
6
-
7
-
8
-
9
-
10
-
11
-
12
-
13
-
14
-
15
-
16
-
17
-
18
-
19
-
20
-
21
-
22
-
23
-
24
-
25
-
26
-
27
-
28
-
29
-
30
-
31
-
32
-
33
-
34
-
35
-
36
-
37
-
38
-
39
-
40
-
41
-
42
-
43
-
44
-
45
-
46
-
47
-
48
-
49
-
50
-
51
-
52
-
53
-
54
-
55
-
56
-
57
-
58
-
59
-
60
-
61
-
62
-
63
-
64
-
65
-
66
-
67
-
68
-
69
-
70
-
71
-
72
-
73
-
74
-
75
-
76
-
77
-
78
-
79
-
80
-
81
-
82
-
83
-
84
-
 85
85 -
 86
86 -
 87
87 -
 88
88 -
 89
89 -
 90
90 -
 91
91 -
 92
92 -
 93
93 -
 94
94 -
 95
95 -
 96
96 -
 97
97 -
 98
98 -
 99
99 -
 100
100 -
 101
101 -
 102
102 -
 103
103 -
 104
104 -
 105
105 -
106
-
107
-
108
-
109
-
110
-
111
-
112
-
113
-
114
-
115
-
116
-
117
-
118
-
119
-
120
-
121
-
122
-
123
-
124
-
125
-
126
-
127
-
128
-
129
-
130
-
131
-
132
-
133
-
134
-
135
-
136
-
137
-
138
-
139
-
140
-
141
-
142
-
143
-
144
-
145
-
146
-
147
-
148
-
149
-
150
-
151
-
152
-
153
-
154
-
155
-
156
-
157
-
158
-
159
-
160
-
161
-
162
-
163
-
164
-
165
-
166
-
167
-
168
-
169
-
170
-
171
-
172
-
173
-
174
-
175
-
176
-
177
-
178
-
179
-
180
-
181
-
182
-
183
-
184
-
185
-
186
-
187
-
188
-
189
-
190
-
191
-
192
-
193
-
194
-
195
-
196
-
197
 |
 |
F-24
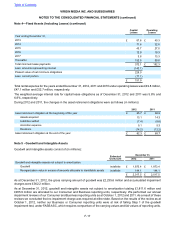
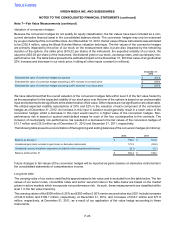
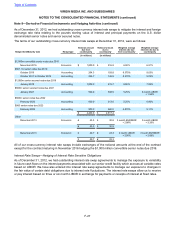
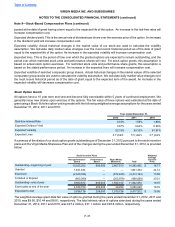
The carrying amounts and fair values of our long term debt, excluding capital leases, were as follows (in millions):
December 31,
2012 December 31,
2011
Carrying
Amount Fair
Value Carrying
Amount Fair
Value
6.50% U.S. dollar convertible senior notes due 2016 £ 544.0 £ 1,276.3 £ 551.1 £869.1
9.50% U.S. dollar senior notes due 2016 — — 849.2 966.4
9.50% euro senior notes due 2016 — — 145.3 170.1
8.375% U.S. dollar senior notes due 2019 309.3 357.6 380.6 416.9
8.875% sterling senior notes due 2019 250.3 287.7 345.2 378.9
5.25% U.S. dollar senior notes due 2022 308.9 321.9 — —
4.875% U.S. dollar senior notes due 2022 555.9 571.5 — —
5.125% sterling senior notes due 2022 400.0 409.0 — —
6.50% U.S. dollar senior secured notes due 2018 611.2 681.6 635.4 663.5
7.00% sterling senior secured notes due 2018 865.9 945.8 864.5 923.1
5.25% U.S. dollar senior secured notes due 2021 350.5 360.5 353.1 321.8
5.50% sterling senior secured notes due 2021 754.1 724.9 722.4 640.3
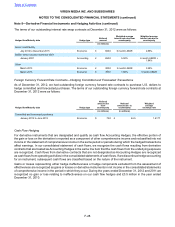
Concentrations of Credit Risk
Our financial instruments that are exposed to concentrations of credit risk consist primarily of cash, trade receivables
and derivative contracts.
At December 31, 2012 and 2011, we had £206.3 million and £300.4 million, respectively, in cash and cash equivalents.
These cash and cash equivalents are on deposit with major financial institutions and, as part of our cash management
process, we perform regular evaluations of the credit standing of these institutions using a range of metrics. We have
not experienced any losses in cash balances and do not believe we are exposed to any significant credit risk on our
cash balances.
Concentrations of credit risk with respect to trade receivables are limited because of the large number of customers.
We perform periodic credit evaluations of our Business segment customers' financial condition and generally do not
require collateral. No single group or customer represents greater than 10% of total accounts receivable.
Concentrations of credit risk with respect to derivative contracts are focused within a limited number of international
financial institutions with which we operate and relate only to derivatives with gross recorded asset balances at
December 31, 2012. We perform regular reviews of the financial institutions with which we operate as to their credit
worthiness and financial condition. We have not experienced non-performance by any of our derivative counterparties
nor do we expect there to be non-performance risks associated with our counterparties. At December 31, 2012, based
on market values, we had 81.9% of our derivative contracts with four financial institutions, each with more than 10%
of our total exposure. At December 31, 2011, based on market values, we had 84.1% of our derivative contracts with
six financial institutions, each with more than 10% of our total exposure.
Table of Contents
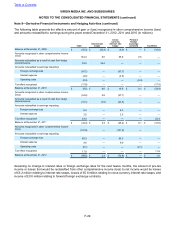
VIRGIN MEDIA INC. AND SUBSIDIARIES
NOTES TO THE CONSOLIDATED FINANCIAL STATEMENTS (continued)
Note 7—Fair Value Measurements (continued)