Virgin Media 2012 Annual Report Download - page 151
Download and view the complete annual report
Please find page 151 of the 2012 Virgin Media annual report below. You can navigate through the pages in the report by either clicking on the pages listed below, or by using the keyword search tool below to find specific information within the annual report.-
 1
1 -
2
-
3
-
4
-
5
-
6
-
7
-
8
-
9
-
10
-
11
-
12
-
13
-
14
-
15
-
16
-
17
-
18
-
19
-
20
-
21
-
22
-
23
-
24
-
25
-
26
-
27
-
28
-
29
-
30
-
31
-
32
-
33
-
34
-
35
-
36
-
37
-
38
-
39
-
40
-
41
-
42
-
43
-
44
-
45
-
46
-
47
-
48
-
49
-
50
-
51
-
52
-
53
-
54
-
55
-
56
-
57
-
58
-
59
-
60
-
61
-
62
-
63
-
64
-
65
-
66
-
67
-
68
-
69
-
70
-
71
-
72
-
73
-
74
-
75
-
76
-
77
-
78
-
79
-
80
-
81
-
82
-
83
-
84
-
85
-
86
-
87
-
88
-
89
-
90
-
91
-
92
-
93
-
94
-
95
-
96
-
97
-
98
-
99
-
100
-
101
-
102
-
103
-
104
-
105
-
106
-
107
-
108
-
109
-
110
-
111
-
112
-
113
-
114
-
115
-
116
-
117
-
118
-
119
-
120
-
121
-
122
-
123
-
124
-
125
-
126
-
127
-
128
-
129
-
130
-
131
-
132
-
133
-
134
-
135
-
136
-
137
-
138
-
139
-
140
-
 141
141 -
 142
142 -
 143
143 -
 144
144 -
 145
145 -
 146
146 -
 147
147 -
 148
148 -
 149
149 -
 150
150 -
 151
151 -
 152
152 -
 153
153 -
 154
154 -
 155
155 -
 156
156 -
 157
157 -
 158
158 -
 159
159 -
 160
160 -
 161
161 -
162
-
163
-
164
-
165
-
166
-
167
-
168
-
169
-
170
-
171
-
172
-
173
-
174
-
175
-
176
-
177
-
178
-
179
-
180
-
181
-
182
-
183
-
184
-
185
-
186
-
187
-
188
-
189
-
190
-
191
-
192
-
193
-
194
-
195
-
196
-
197
 |
 |
F-80
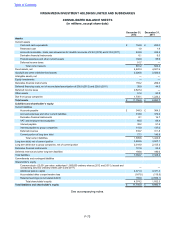
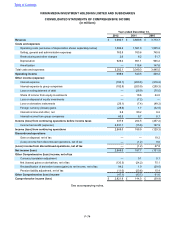
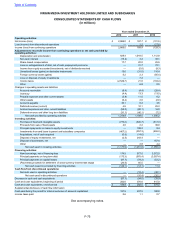
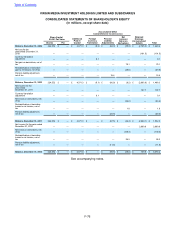
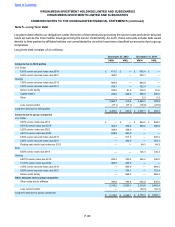
VIRGIN MEDIA INVESTMENTS LIMITED AND SUBSIDIARIES
CONSOLIDATED STATEMENTS OF SHAREHOLDER’S EQUITY
(in millions, except share data)
Accumulated Other
Comprehensive Income (Loss)
Common
Stock £1.0
Par Value
Additional
Paid-In
Capital
Foreign
Currency
Translation
Pension
Liability
Adjustments
Net
(Losses)
Gains on
Derivatives
Retained
Earnings
(Accumulated
Deficit) Total
Balance, December 31, 2009 £ 1.0 £ 4,370.3 £ (0.2) £ (82.3) £ (55.3) £ (2,785.3) £ 1,448.2
Issue of common stock 1.5 (1.5) — — — — —
Net loss for the year ended
December 31, 2010 —————(101.5)(101.5)
Currency translation adjustment — — 0.1 — — — 0.1
Net gains on derivatives, net of tax — — — — 75.1 — 75.1
Reclassification of derivative gain to
net losses, net of tax — — — — (29.0) — (29.0)
Pension liability adjustment, net of
tax — — — 15.4 — — 15.4
Balance, December 31, 2010 £ 2.5 £ 4,368.8 £ (0.1) £ (66.9) £ (9.2) £ (2,886.8) £ 1,408.3
Net income for the year ended
December 31, 2011 —————187.7 187.7
Currency translation adjustment — — 0.1 — — — 0.1
Net losses on derivatives, net of tax — — — — (24.2) — (24.2)
Reclassification of derivative losses
to net income, net of tax — — — — 1.0 — 1.0
Pension liability adjustment, net of
tax — — — (20.6) — — (20.6)
Balance, December 31, 2011 £ 2.5 £ 4,368.8 £ — £ (87.5) £ (32.4) £ (2,699.1) £ 1,552.3
Net income for the year ended
December 31, 2012 — — — — — 2,869.0 2,869.0
Net losses on derivatives, net of tax — — — — (130.3) (130.3)
Reclassification of derivative losses
to net income, net of tax — — — — 94.2 94.2
Pension liability adjustment, net of
tax — — — (11.0) — — (11.0)
Balance, December 31, 2012 £ 2.5 £ 4,368.8 £ — £ (98.5) £ (68.5) £ 169.9 £ 4,374.2
See accompanying notes.
Table of Contents