Virgin Media 2012 Annual Report Download - page 56
Download and view the complete annual report
Please find page 56 of the 2012 Virgin Media annual report below. You can navigate through the pages in the report by either clicking on the pages listed below, or by using the keyword search tool below to find specific information within the annual report.-
 1
1 -
2
-
3
-
4
-
5
-
6
-
7
-
8
-
9
-
10
-
11
-
12
-
13
-
14
-
15
-
16
-
17
-
18
-
19
-
20
-
21
-
22
-
23
-
24
-
25
-
26
-
27
-
28
-
29
-
30
-
31
-
32
-
33
-
34
-
35
-
36
-
37
-
38
-
39
-
40
-
41
-
42
-
43
-
44
-
45
-
 46
46 -
 47
47 -
 48
48 -
 49
49 -
 50
50 -
 51
51 -
 52
52 -
 53
53 -
 54
54 -
 55
55 -
 56
56 -
 57
57 -
 58
58 -
 59
59 -
 60
60 -
 61
61 -
 62
62 -
 63
63 -
 64
64 -
 65
65 -
 66
66 -
67
-
68
-
69
-
70
-
71
-
72
-
73
-
74
-
75
-
76
-
77
-
78
-
79
-
80
-
81
-
82
-
83
-
84
-
85
-
86
-
87
-
88
-
89
-
90
-
91
-
92
-
93
-
94
-
95
-
96
-
97
-
98
-
99
-
100
-
101
-
102
-
103
-
104
-
105
-
106
-
107
-
108
-
109
-
110
-
111
-
112
-
113
-
114
-
115
-
116
-
117
-
118
-
119
-
120
-
121
-
122
-
123
-
124
-
125
-
126
-
127
-
128
-
129
-
130
-
131
-
132
-
133
-
134
-
135
-
136
-
137
-
138
-
139
-
140
-
141
-
142
-
143
-
144
-
145
-
146
-
147
-
148
-
149
-
150
-
151
-
152
-
153
-
154
-
155
-
156
-
157
-
158
-
159
-
160
-
161
-
162
-
163
-
164
-
165
-
166
-
167
-
168
-
169
-
170
-
171
-
172
-
173
-
174
-
175
-
176
-
177
-
178
-
179
-
180
-
181
-
182
-
183
-
184
-
185
-
186
-
187
-
188
-
189
-
190
-
191
-
192
-
193
-
194
-
195
-
196
-
197
 |
 |

55
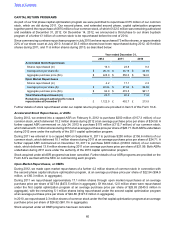
In 2010 cash used in investing activities of £411.4 million was principally comprised of purchases of fixed assets totaling
£628.4 million, partially offset by the proceeds from the sale of Virgin Media Television and disposal of 42 properties.
Financing Activities
During 2012 cash used in financing activities totaled £348.5 million compared to £1,001.1 million in 2011.
Cash provided by financing activities in 2012 of £1,441.7 million arose principally from the issuance of our $500 million
5.25% U.S. dollar senior notes due 2022, our $900 million 4.875% U.S. dollar senior notes due 2022, and our £400
million 5.125% sterling senior notes due 2022, together with two drawings of our RCF of £100.0 million and £75.0
million, both of which were repaid during the year.
Principal payments on long-term debt of £1,317.2 million during 2012 has been principally used to fully redeem our
$1,350 million U.S. dollar denominated and €180 million euro denominated 9.5% unsecured senior notes due 2016,
to repay in full both the £100 million and £75 million draw downs of the RCF, and to partially repay our $600 million
8.375% U.S. dollar denominated and £350.0 million 8.875% sterling denominated senior notes due 2019. We also
used £28.3 million to settle cross currency interest rate swaps as part of these redemptions. As more fully described
in the following Capital Returns section, we also used £330.2 million of cash to repurchase our common stock during
2012.
Capital lease payments during 2012 increased to £97.7 million compared to £79.2 million in 2011, principally as a
result of increased leasing activity related to customer premises equipment to support our TiVo rollout.
In 2011 cash used in financing activities was £1,001.1 million compared with £551.8 million in 2010, with the increase
being principally the partial repayments of our previous senior credit facility and repayment of our 9.125% U.S. dollar
senior notes due 2016 totaling £1,315.8 million, capital lease payments totaling £79.2 million and purchases of our
own shares totaling £635.0 million. The principal components of cash provided by financing activities were new
borrowings from the issuance of our senior notes due 2021, net of financing fees, of £977.0 million, and the proceeds
from the settlement of cross currency interest rate swaps of £65.5 million.
In 2010 the principal uses of cash in financing activities were the partial repayments under our previous senior credit
facility and repayment of our senior notes due 2014 totaling £3,186.6 million, capital lease payments totaling £53.2
million, purchases of our own shares totaling £161.5 million and the purchase of conversion hedges relating to the
shares issuable under our convertible senior notes totaling £205.4 million. The principal components of cash provided
by financing activities in 2010 were new borrowings from the issuance of our senior notes due 2016 and our senior
notes due 2019, net of financing fees, of £3,072.0 million.
During 2012 we paid four quarterly dividends of $0.04 per share of common stock, resulting in a total cash outflow of
£27.3 million. The dividend per share of common stock is equivalent to that paid during 2011 and 2010, with the lower
total cash payment arising from having fewer shares of common stock in issue. Further details of dividend payments
are provided in Item 5 of this Form 10-K.
Cash flows from discontinued operations for the years ended December 31, 2011 and 2010 are attributable to Virgin
Media TV.
Table of Contents