Virgin Media 2012 Annual Report Download - page 44
Download and view the complete annual report
Please find page 44 of the 2012 Virgin Media annual report below. You can navigate through the pages in the report by either clicking on the pages listed below, or by using the keyword search tool below to find specific information within the annual report.-
 1
1 -
2
-
3
-
4
-
5
-
6
-
7
-
8
-
9
-
10
-
11
-
12
-
13
-
14
-
15
-
16
-
17
-
18
-
19
-
20
-
21
-
22
-
23
-
24
-
25
-
26
-
27
-
28
-
29
-
30
-
31
-
32
-
33
-
 34
34 -
 35
35 -
 36
36 -
 37
37 -
 38
38 -
 39
39 -
 40
40 -
 41
41 -
 42
42 -
 43
43 -
 44
44 -
 45
45 -
 46
46 -
 47
47 -
 48
48 -
 49
49 -
 50
50 -
 51
51 -
 52
52 -
 53
53 -
 54
54 -
55
-
56
-
57
-
58
-
59
-
60
-
61
-
62
-
63
-
64
-
65
-
66
-
67
-
68
-
69
-
70
-
71
-
72
-
73
-
74
-
75
-
76
-
77
-
78
-
79
-
80
-
81
-
82
-
83
-
84
-
85
-
86
-
87
-
88
-
89
-
90
-
91
-
92
-
93
-
94
-
95
-
96
-
97
-
98
-
99
-
100
-
101
-
102
-
103
-
104
-
105
-
106
-
107
-
108
-
109
-
110
-
111
-
112
-
113
-
114
-
115
-
116
-
117
-
118
-
119
-
120
-
121
-
122
-
123
-
124
-
125
-
126
-
127
-
128
-
129
-
130
-
131
-
132
-
133
-
134
-
135
-
136
-
137
-
138
-
139
-
140
-
141
-
142
-
143
-
144
-
145
-
146
-
147
-
148
-
149
-
150
-
151
-
152
-
153
-
154
-
155
-
156
-
157
-
158
-
159
-
160
-
161
-
162
-
163
-
164
-
165
-
166
-
167
-
168
-
169
-
170
-
171
-
172
-
173
-
174
-
175
-
176
-
177
-
178
-
179
-
180
-
181
-
182
-
183
-
184
-
185
-
186
-
187
-
188
-
189
-
190
-
191
-
192
-
193
-
194
-
195
-
196
-
197
 |
 |

43
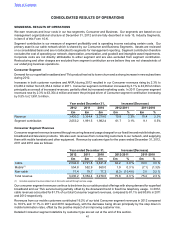
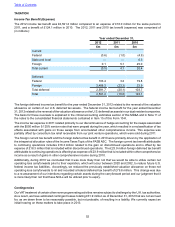
An increase in the proportion of contract customers generally results in our mobile customer base becoming more
profitable, although the step down in regulated mobile termination rates reduced inbound mobile revenue by
approximately £24 million during 2012 compared to 2011, resulting in mobile ARPU decreasing to £15.13 during the
quarter ended December 31, 2012 compared to £15.46 for the quarter to December 31, 2011. Overall, the impact of
the factors discussed above was to modestly increase total mobile revenues in 2012 to £554.8 million from £552.9
million in 2011.
During 2011 the number of mobile customers decreased by a net 31,600 customers with contract customer net gains
of 313,100 being offset by a net loss of 344,700 prepay customers. The growth in contract customers during 2011
reflected our strategy of using our own sales channels and cross-selling mobile contracts to our cable customers. The
decline in prepay customers reflects increased competition in the prepay market and our strategy of migrating prepay
customers to contracts due to the lower churn, higher ARPU and higher overall lifetime value of contract customers.
Mobile ARPU increased to £15.46 for the quarter to December 31, 2011 from £15.16 for the quarter to December 31,
2010, primarily due to an increased proportion of higher value contract customers relative to the total number of mobile
customers, which rose to 50.2% at December 31, 2011 from 39.5% at December 31, 2010, partially offset by a fall in
revenue due to the regulated change in mobile termination rates.
Total mobile revenues in 2011 decreased to £552.9 million from £560.0 million in 2010, principally as a result of the
regulated change in mobile termination rates, which reduced inbound revenue, and a decline in the number of prepay
customers, partially offset by an increase in service revenues, mainly driven by increased contract revenue.
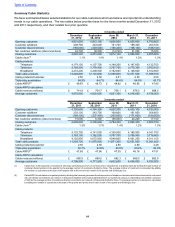
Non-cable
Total non-cable customers decreased by 55,400 during 2012 due to competition in the market which continues to
increase as our competitors upgrade their networks to provide fiber based services in areas which are outside of our
cable network. The decline of 28,500 non-cable products during 2011 was also due to increased competition in the
market.
As a result of this drop in customer numbers, although partially offset by prices rises, non-cable revenues have
decreased by 10.4% in 2012 to £71.4 million compared to 2011.
Non-cable revenue for the year ended December 31, 2011 increased to £79.7 million from £77.2 million for the year
ended December 31, 2010. The increased non-cable revenue was predominantly driven by an increase in the
percentage of customers taking both phone and broadband in the year ended December 31, 2011, as compared to
the prior year, partially offset by a decline in the number of customers.
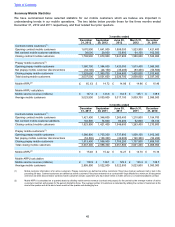
Consumer Segment Contribution
During 2012, Consumer segment contribution increased to £2,053.2 million from £1,991.5 million in 2011, being a
3.1% increase, continuing the trend seen in 2011 when segment contribution increased modestly from £1,982.4 in
2010. In both cases the increased consumer revenues described above have been the principal driver of increased
segment contribution, although offset in 2012 by our step-change increase in marketing expenses.
The principal components of operating costs and selling, general, and administrative expenses within our consumer
segment include:
• television programming services and programming costs;
• payroll and other employee related costs, including outsourcing;
• marketing and selling costs;
• interconnect costs paid to carriers relating to call termination services; and
• purchase costs of mobile handsets and other equipment.
Further discussion of the movement in these costs is provided in the operating expenses section of this MD&A.
Table of Contents