Virgin Media 2012 Annual Report Download - page 144
Download and view the complete annual report
Please find page 144 of the 2012 Virgin Media annual report below. You can navigate through the pages in the report by either clicking on the pages listed below, or by using the keyword search tool below to find specific information within the annual report.-
 1
1 -
2
-
3
-
4
-
5
-
6
-
7
-
8
-
9
-
10
-
11
-
12
-
13
-
14
-
15
-
16
-
17
-
18
-
19
-
20
-
21
-
22
-
23
-
24
-
25
-
26
-
27
-
28
-
29
-
30
-
31
-
32
-
33
-
34
-
35
-
36
-
37
-
38
-
39
-
40
-
41
-
42
-
43
-
44
-
45
-
46
-
47
-
48
-
49
-
50
-
51
-
52
-
53
-
54
-
55
-
56
-
57
-
58
-
59
-
60
-
61
-
62
-
63
-
64
-
65
-
66
-
67
-
68
-
69
-
70
-
71
-
72
-
73
-
74
-
75
-
76
-
77
-
78
-
79
-
80
-
81
-
82
-
83
-
84
-
85
-
86
-
87
-
88
-
89
-
90
-
91
-
92
-
93
-
94
-
95
-
96
-
97
-
98
-
99
-
100
-
101
-
102
-
103
-
104
-
105
-
106
-
107
-
108
-
109
-
110
-
111
-
112
-
113
-
114
-
115
-
116
-
117
-
118
-
119
-
120
-
121
-
122
-
123
-
124
-
125
-
126
-
127
-
128
-
129
-
130
-
131
-
132
-
133
-
 134
134 -
 135
135 -
 136
136 -
 137
137 -
 138
138 -
 139
139 -
 140
140 -
 141
141 -
 142
142 -
 143
143 -
 144
144 -
 145
145 -
 146
146 -
 147
147 -
 148
148 -
 149
149 -
 150
150 -
 151
151 -
 152
152 -
 153
153 -
 154
154 -
155
-
156
-
157
-
158
-
159
-
160
-
161
-
162
-
163
-
164
-
165
-
166
-
167
-
168
-
169
-
170
-
171
-
172
-
173
-
174
-
175
-
176
-
177
-
178
-
179
-
180
-
181
-
182
-
183
-
184
-
185
-
186
-
187
-
188
-
189
-
190
-
191
-
192
-
193
-
194
-
195
-
196
-
197
 |
 |

F-73
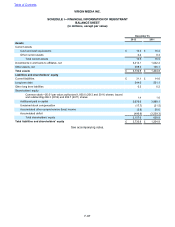
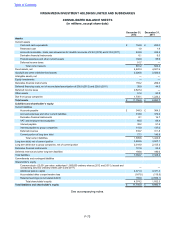
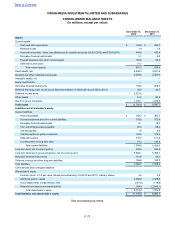
VIRGIN MEDIA INVESTMENT HOLDINGS LIMITED AND SUBSIDIARIES
CONSOLIDATED BALANCE SHEETS
(in millions, except share data)
December 31,
2012 December 31,
2011
Assets
Current assets
Cash and cash equivalents £ 194.9 £282.0
Restricted cash 1.9 1.9
Accounts receivable - trade, less allowances for doubtful accounts of £9.0 (2012) and £10.9 (2011) 443.8 435.4
Derivative financial instruments 6.1 9.5
Prepaid expenses and other current assets 102.8 95.6
Deferred income taxes 51.7 —
Total current assets 801.2 824.4
Fixed assets, net 4,420.3 4,501.6
Goodwill and other indefinite-lived assets 2,026.6 2,026.6
Intangible assets, net — —
Equity investments — —
Derivative financial instruments 159.2 209.6
Deferred financing costs, net of accumulated amortization of £36.8 (2012) and £28.0 (2011) 35.9 44.5
Deferred income taxes 2,527.4 —
Other assets 51.2 50.8
Due from group companies 1,735.1 1,223.2
Total assets £ 11,756.9 £ 8,880.7
Liabilities and shareholder’s equity
Current liabilities
Accounts payable £ 349.3 £304.3
Accrued expenses and other current liabilities 318.8 372.0
Derivative financial instruments 8.1 16.7
VAT and employee taxes payable 85.5 88.4
Interest payable 38.2 51.5
Interest payable to group companies 115.9 137.0
Deferred revenue 316.7 311.8
Current portion of long term debt 77.1 140.9
Total current liabilities 1,309.6 1,422.6
Long term debt, net of current portion 3,483.6 3,507.1
Long term debt due to group companies, net of current portion 2,319.0 2,155.3
Derivative financial instruments 101.9 53.4
Deferred revenue and other long term liabilities 168.6 190.0
Total liabilities 7,382.7 7,328.4
Commitments and contingent liabilities
Shareholder’s equity
Common stock - £0.001 par value; authorized 1,000,000 ordinary shares (2012 and 2011); issued and
outstanding 224,552 ordinary shares (2012 and 2011) — —
Additional paid-in capital 4,371.3 4,371.3
Accumulated other comprehensive loss (167.0)(119.9)
Retained earnings (accumulated deficit) 169.9 (2,699.1)
Total shareholder’s equity 4,374.2 1,552.3
Total liabilities and shareholder’s equity £ 11,756.9 £ 8,880.7
See accompanying notes.
Table of Contents